A) savanna-low temperature,precipitation uniform during the year
B) tundra-long summers,mild winters
C) temperate broadleaf forest-relatively short growing season,mild winters
D) tropical forests-nearly constant day length and temperature
Correct Answer

verified
Correct Answer
verified
Multiple Choice
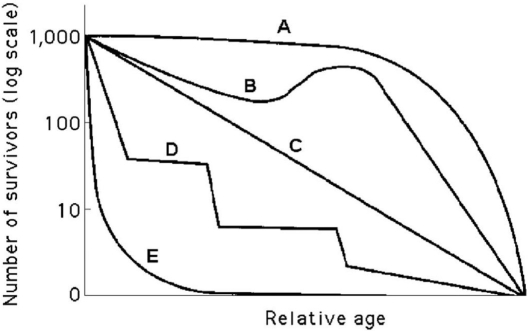
Which of the following describes a Type II survivorship curve?
A) flat at the start,then dropping steeply as death rates increase
B) dropping sharply at the start,then flattening out as death rates decline
C) a constant decline with a constant death rate over the life span
D) flat at the start,then rising steeply as death rates decrease
Correct Answer

verified
Correct Answer
verified
Multiple Choice
 Figure 40.3
-Which curve best describes survivorship in elephants?
A) A
B) B
C) C
D) D
E) E
Correct Answer

verified
Correct Answer
verified
Multiple Choice
In models of logistic population growth,
A) the population growth rate slows,eventually becoming zero as N approaches K.
B) new individuals are added to the population most rapidly as K approaches N.
C) new individuals are added to the population most rapidly as N approaches K.
D) only density-independent environmental factors affect the rate of population growth.
E) carrying capacity is the number of additional individuals the environment can support.
Correct Answer

verified
Correct Answer
verified
Multiple Choice
 Figure 40.3
-Which curve best describes survivorship in humans who live in developed nations?
A) A
B) B
C) C
D) D
E) E
Correct Answer

verified
Correct Answer
verified
Multiple Choice
Which of the following are important biotic factors that can affect the structure and organization of biological communities?
A) precipitation,wind
B) nutrient availability,soil pH
C) predation,competition
D) temperature,water
E) light intensity,seasonality
Correct Answer

verified
Correct Answer
verified
Multiple Choice
Which of the following reproductive strategies is consistent with energetic trade-off and reproductive success?
A) Pioneer species of plants produce many very small,highly airborne seeds.
B) Rabbits that suffer high predation rates produce several litters per breeding season.
C) Animals that are caring parents produce fewer offspring with lower infant mortality.
D) A flowering plant nurtures its thousands of seeds until they are ready to germinate.
Correct Answer

verified
Correct Answer
verified
Multiple Choice
In which of the following terrestrial biome pairs are both biomes dependent upon periodic burning?
A) tundra and coniferous forest
B) chaparral and savanna
C) desert and savanna
D) tropical and broadleaf forest
E) grassland and tundra
Correct Answer

verified
Correct Answer
verified
Multiple Choice
A population of ground squirrels has an annual per capita birth rate of 0.06 and an annual per capita death rate of 0.02.Calculate an estimate of the number of individuals added to (or lost from) a population of 1,000 individuals in one year.
A) 120 individuals added
B) 40 individuals added
C) 20 individuals added
D) 400 individuals added
E) 20 individuals lost
Correct Answer

verified
Correct Answer
verified
Multiple Choice
A cosmic catastrophic event occurred that caused the tilt of the Earth's axis relative to its plane of orbit to increase from 23.5 degrees to 90 degrees.The most obvious effect of this change would be
A) the elimination of trade winds.
B) an increase in the length of night.
C) an increase in the length of a year.
D) the elimination of seasonal variation.
Correct Answer

verified
Correct Answer
verified
Multiple Choice
Please use the following information to answer the question(s) below.
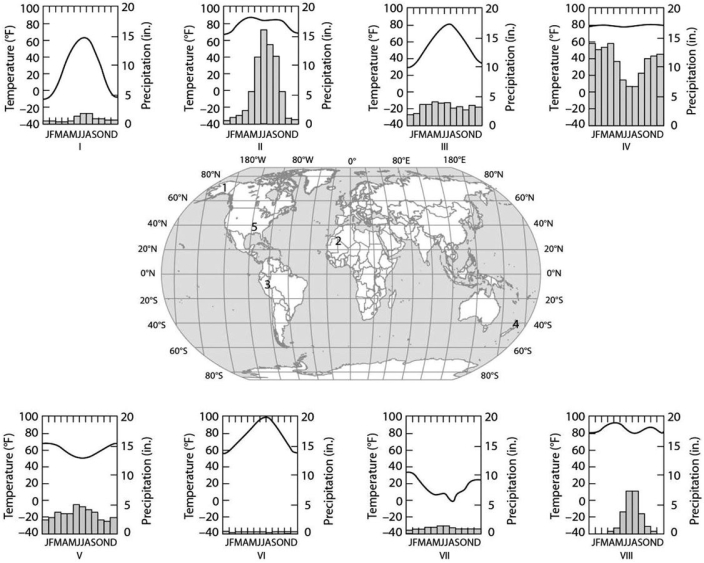
The eight climographs in Figure 40.1 show yearly temperature (line graph and left vertical axis) and precipitation (bar graph and right vertical axis) averages for each month for some locations on Earth.Choose the climograph that best answers the question.
 Figure 40.1
-Which climograph shows the climate for location 4?
A) I
B) II
C) III
D) V
E) VI
Correct Answer

verified
Correct Answer
verified
Multiple Choice
Imagine you are managing a large game ranch.You know from historical accounts that a species of deer used to live there,but they have been extirpated.You decide to reintroduce them.After doing some research to determine what might be an appropriate size founding population,you do so.You watch the population increase for several generations and then graph the number of individuals (vertical axis) against the number of generations (horizontal axis) .The graph will likely appear as
A) a diagonal line,getting higher with each generation.
B) an "S," increasing with each generation.
C) an upside-down "U."
D) a "J," increasing with each generation.
E) an "S" that ends with a vertical line.
Correct Answer

verified
Correct Answer
verified
Multiple Choice
Natural selection involves energetic trade-offs between
A) choosing how many offspring to produce over the course of a lifetime and how long to live.
B) producing larger numbers of gametes with internal fertilization versus external fertilization.
C) increasing the quantity of offspring per reproductive episode and an increase in parental care.
D) ensuring high offspring survival rates per reproductive episode and the cost of parental care.
Correct Answer

verified
Correct Answer
verified
Multiple Choice
Which of the following models is used to examine decreases in the rate of population growth as population size approaches carrying capacity?
A) exponential growth
B) logistic growth model
C) survivorship curve
D) intrinsic rate of increase
Correct Answer

verified
Correct Answer
verified
Multiple Choice
Which of the following graphs illustrates the growth curve of a small population of rodents that has grown to reach a static carrying capacity?
A) ![]()
B) ![]()
C) ![]()
D) ![]()
E) ![]()
Correct Answer

verified
Correct Answer
verified
Multiple Choice
The three basic variables that make up the life history of an organism are
A) life expectancy of females in the population,birth rate of offspring,and death rate of offspring.
B) number of reproductive females in the population,age structure of the population,and life expectancy.
C) age when reproduction begins,how often reproduction occurs,and how many offspring are produced per reproductive episode.
D) how often reproduction occurs,life expectancy of females in the population,and number of offspring per reproductive episode.
E) the number of reproductive females in the population,how often reproduction occurs,and death rate.
Correct Answer

verified
Correct Answer
verified
Multiple Choice
Which of the following statements best describes the interaction between fire and ecosystems?
A) Fires maintain the low,widely scattered vegetation found in deserts.
B) Many kinds of plants and plant communities have adapted to frequent fires.
C) Many species in temperate broadleaf forests depend on fire to regenerate.
D) Chaparral communities have evolved to the extent that they rarely burn.
E) Most species have not adapted to fire as it is unnatural in every ecosystem.
Correct Answer

verified
Correct Answer
verified
Multiple Choice
Please use the following information to answer the question(s) below.
The eight climographs in Figure 40.1 show yearly temperature (line graph and left vertical axis) and precipitation (bar graph and right vertical axis) averages for each month for some locations on Earth.Choose the climograph that best answers the question.
 Figure 40.1
-Which of the following best substantiates why location 3 is an equatorial (tropical) climate?
A) It has a monsoon season during the winter months.
B) It has consistent monthly averages for rainfall.
C) The temperature is high for each monthly average.
D) The temperatures reach 100°F during some months.
E) The temperatures are lower in June,July,and August.
Correct Answer

verified
Correct Answer
verified
Multiple Choice
Which of the following is a physical factor that can limit the geographic distribution of species?
A) predation
B) disease
C) soil structure
D) nutrients
E) pH
Correct Answer

verified
Correct Answer
verified
Multiple Choice
Areas where terrestrial biomes grade into neighboring biomes way be wide or narrow.Which of the following terms best describes this intergradation?
A) latitude
B) ecotone
C) longitude
D) ecosystem
Correct Answer

verified
Correct Answer
verified
Showing 41 - 60 of 93
Related Exams