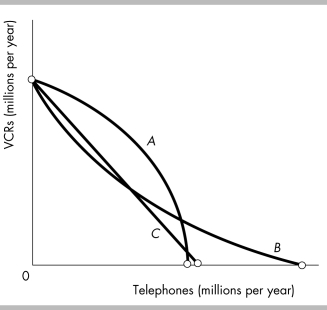
A) allocation efficiency and possibly production efficiency
B) production efficiency and possibly allocative efficiency in the production
C) allocative and production efficiency in the production
D) neither allocative nor production efficiency
Correct Answer

verified
Correct Answer
verified
Multiple Choice
Big Lobster sells lobster and fish, and so too does H Salt. If Big Lobster's opportunity cost of preparing lobster exceeds H Salt's opportunity cost, then all the following are true EXCEPT )
A) they will both gain if Big Lobster sells fish and H Salt sells lobster.
B) Big Lobster has a comparative advantage in lobster.
C) H Salt has a comparative advantage in lobster.
D) H Salt doesn't have a comparative advantage in cooking fish.
Correct Answer

verified
Correct Answer
verified
Multiple Choice
Tom and Di grow tomatoes and turnips. Tom has a comparative advantage in growing tomatoes if )
A) Tom can grow more tomatoes than Di can
B) his marginal benefit from tomatoes is greater than Di's
C) his opportunity cost of tomatoes is less than Di's opportunity cost of tomatoes
D) his opportunity cost of tomatoes is less than his opportunity cost of turnips
Correct Answer

verified
Correct Answer
verified
Multiple Choice
If the marginal benefit of consuming another unit of a good is positive, then to reach the allocatively efficient level of output more of the good should be consumed
A) if the total benefit is greater than the total cost.
B) no matter what..
C) if the marginal benefit is greater than the marginal cost.
D) as long as the consumer can afford to pay for it.
Correct Answer

verified
Correct Answer
verified
Multiple Choice
The marginal benefit from a good is the maximum amount a person is willing to pay for
A) one more unit of the good.
B) all of the units of the good the person consumes divided by the number of units he or she purchases.
C) one more unit of the good divided by the number of units purchased.
D) all of the good the person consumes.
Correct Answer

verified
Correct Answer
verified
Multiple Choice
A person who has an absolute advantage in the production of all goods will
A) not be able to gain from specialization and exchange.
B) have a comparative advantage only in the production of some goods but not for others.
C) have a production possibilities frontier with a constant slope.
D) also have a comparative advantage in the production of all goods.
Correct Answer

verified
Correct Answer
verified
Multiple Choice
One point on a PPF shows production levels at 50 tons of coffee and 100 tons of bananas. Remaining on the PPF, an increase of banana production to 140 tons shows coffee production at 30 tons. Still remaining on the PPF, coffee production at 10 tons allows banana production at 160 tons. The opportunity cost of a ton of bananas is
A) constant because coffee production decreased by the same amount each time.
B) 16 to 1, that is every 1 ton of coffee given up will result in 16 more tons of bananas.
C) decreasing, since the increase in banana production is less at each point considered.
D) increasing from 1/2 ton of coffee per ton of bananas to 1 ton of coffee per ton of bananas.
Correct Answer

verified
Correct Answer
verified
Multiple Choice
An economy that uses new technology .
A) has its PPF shift inward because more unemployment is created
B) does not incur an opportunity cost because everyone can use new technology
C) experiences economic growth but incurs an opportunity cost
D) moves along its PPF and incurs an opportunity cost
Correct Answer

verified
Correct Answer
verified
Multiple Choice
The quantity of shoes produced is measured along the horizontal axis of a PPF and the quantity of shirts is measured along the vertical axis. As you move down toward the right along the PPF, the marginal cost of
A) shoes and shirts is equal at the midpoint between the vertical and horizontal axis.
B) shoes increases.
C) shirts increases.
D) shoes decreases.
Correct Answer

verified
Correct Answer
verified
Multiple Choice
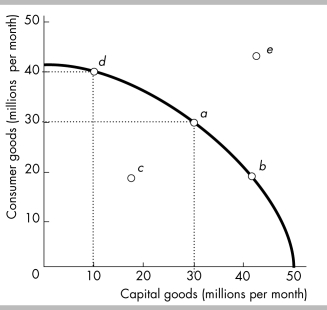
 -Refer to the production possibilities frontier in the figure above. Which production point is unattainable?
A) Point a
B) Point b
C) Point c
D) Point e
Correct Answer

verified
Correct Answer
verified
Multiple Choice
Which of the following is TRUE regarding marginal benefit? I. The marginal benefit curve shows the benefit firms receive by producing another unit of a good II. Marginal benefit increases as more and more of a good is consumed. III. Marginal benefit shows the maximum amount a person is willing to pay to obtain one more uni good.
A) III only
B) I and II
C) II and III
D) I and III
Correct Answer

verified
Correct Answer
verified
Multiple Choice
 -The above table shows production combinations on a country's production possibilities frontier. What is the opportunity cost of increasing the production of X from 0 to 3 units?
A) 0 units of good Y
B) 3 units of good Y
C) 40 units of good Y
D) 4/3 units of good Y for every one unit of good X
Correct Answer

verified
Correct Answer
verified
Multiple Choice
The slope of a production possibilities frontier that displays increasing opportunity cost is
A) negative and constant.
B) steeper near the vertical intercept than near the horizontal intercept.
C) positive and constant.
D) steeper near the horizontal intercept than near the vertical intercept.
Correct Answer

verified
Correct Answer
verified
Multiple Choice
 Production possibilities
-The table above shows the production possibilities frontier for the economy of Sauria. If the economy is able to produce 7 hundred guns and 10 tons of butter next year, we can conclude that next year
A) the amount of resources or technology has increased.
B) the economy has moved along its production possibilities frontier.
C) the production possibilities frontier has shifted inward.
D) efficiency has decreased.
Correct Answer

verified
Correct Answer
verified
Multiple Choice
 -The data in the above table demonstrates that gains from trade can be captured if
A) each country became self- sufficient, produced both goods for itself, and did not engage in trade.
B) the United States produced concrete in exchange for steel produced in France.
C) the United States produced steel in exchange for concrete produced in France.
D) the United States produced both goods.
Correct Answer

verified
Correct Answer
verified
Multiple Choice
 -The table above represents different points along a production possibilities curve. What is the marginal cost of moving from 2 bushels to 3 bushels of beans?
A) 21 bushels of carrots per bushel of beans
B) 12 bushels of carrots per bushel of beans
C) 9 bushels of carrots per bushel of beans
D) 3 bushels of carrots per bushel of beans
Correct Answer

verified
Correct Answer
verified
Multiple Choice
 -The above table shows the production possibilities frontier for the economy of Arkadia. The opportunity cost of increasing cheese production from 500 tons of cheese to 750 tons of cheese is
A) 700 gallons of wine.
B) 100 gallons of wine.
C) 250 tons of cheese.
D) 300 gallons of wine.
Correct Answer

verified
Correct Answer
verified
Multiple Choice
 -Refer to the table above, which gives five points on a nation's PPF. As we increase the production of
X,
A) unemployment increases.
B) the opportunity cost of each new unit of X increases.
C) the output of Y increases.
D) the opportunity cost of each new unit of X decreases.
Correct Answer

verified
Correct Answer
verified
Multiple Choice
 -Production points inside the PPF are
A) inefficient and not attainable.
B) efficient but not attainable.
C) inefficient and attainable.
D) efficient and attainable.
Correct Answer

verified
Correct Answer
verified
Multiple Choice
 -In the table above, country A is producing 4 units of X and 8 units of Y and country B is producing 4 units of X and 6 units of Y. The opportunity cost of producing more of
A) good X is the same for both countries.
B) good Y is lower in country A.
C) good Y is the same for both countries.
D) good X is lower in country A.
Correct Answer

verified
Correct Answer
verified
Showing 321 - 340 of 503
Related Exams