A) 50
B) 100
C) 200
D) 300
Correct Answer

verified
Correct Answer
verified
Multiple Choice
Which of the following statements is correct?
A) The value of the independent variable is determined by the value of the dependent variable.
B) The value of the dependent variable is determined by the value of the independent variable.
C) The dependent variable designates the "cause" and the independent variable the "effect."
D) Dependent variables graph as upsloping lines; independent variables graph as downward sloping lines.
Correct Answer

verified
Correct Answer
verified
Multiple Choice
When an economy is operating with maximum efficiency, the production of more of commodity A will mean the production of less of commodity B because:
A) of the law of decreasing opportunity costs.
B) material wants are insatiable.
C) resources are limited.
D) resources are not specialized and are imperfectly substitutable.
Correct Answer

verified
Correct Answer
verified
Multiple Choice
Any point inside the production possibilities curve indicates:
A) the realization of allocative efficiency.
B) that resources are imperfectly shiftable among alternative uses.
C) the presence of inflationary pressures.
D) that more output could be produced with available resources.
Correct Answer

verified
Correct Answer
verified
Multiple Choice
The institution that coordinates actions of consumers and producers to establish prices for goods and services is known as:
A) a market.
B) a monopoly.
C) a production possibilities curve.
D) consumer sovereignty.
Correct Answer

verified
Correct Answer
verified
Multiple Choice
 The above data suggest that:
A) a policy of tax reduction will increase consumption.
B) a policy of tax increases will increase consumption.
C) tax changes will have no impact on consumption.
D) after-tax income should be lowered to increase consumption.
Correct Answer

verified
Correct Answer
verified
Multiple Choice
Purposeful behaviour suggests that:
A) everyone will make identical choices.
B) resource availability exceeds material wants.
C) individuals make decisions with some desired outcome in mind.
D) an individual's economic goals cannot involve tradeoffs.
Correct Answer

verified
Correct Answer
verified
True/False
Choices entail marginal costs because resources are scarce.
Correct Answer

verified
Correct Answer
verified
Multiple Choice
Economic resources are also called:
A) free gifts of nature.
B) consumption goods.
C) units of money capital.
D) factors of production.
Correct Answer

verified
Correct Answer
verified
Multiple Choice
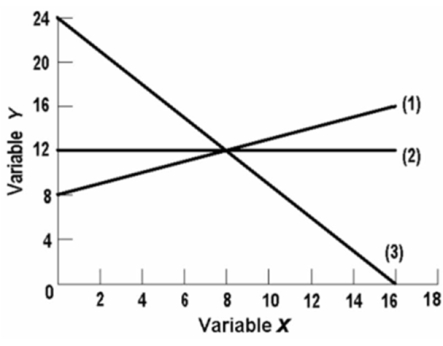
 The linear equation for line (1) on the above graph is:
A) y = 8 + 2x.
B) y = 8 + .5x.
C) x = 8 + .5y.
D) y = 8 - 2x.
Correct Answer

verified
Correct Answer
verified
Multiple Choice
Production possibilities (alternatives)  Refer to the above table.For these data the law of increasing opportunity costs is reflected in the fact that:
A) the amount of consumer goods which must be sacrificed to get more capital goods diminishes beyond a point.
B) larger and larger amounts of capital goods must be sacrificed to get additional units of consumer goods.
C) the production possibilities data would graph as a straight downsloping line.
D) the economy's resources are presumed not to be scarce.
Correct Answer

verified
Correct Answer
verified
True/False
Normative statements are expressions of facts.
Correct Answer

verified
Correct Answer
verified
Multiple Choice
The law of increasing opportunity costs is reflected in a production possibilities curve which is:
A) an upward sloping straight line.
B) a downward sloping straight line.
C) concave to the origin.
D) convex to the origin.
Correct Answer

verified
Correct Answer
verified
Multiple Choice
The individuals and society both face an economic problem.This problem arises from the fact that:
A) wants are limited but the resources are not.
B) resources are scarce relative to individual's wants.
C) individuals and institutions behave only in their self-interest.
D) both wants and resources are unlimited.
Correct Answer

verified
Correct Answer
verified
True/False
An economy cannot produce at a point outside of its production possibilities curve because human material wants are insatiable.
Correct Answer

verified
Correct Answer
verified
Multiple Choice
(The following economy produces two products.) Production Possibilities Table
 Refer to the above table.A change from possibility C to B means that:
A) 1 unit of steel is given up to get 75 units of wheat.
B) 2 units of steel are given up to get 75 units of wheat.
C) 1 unit of steel is given up to get 15 more units of wheat.
D) 2 units of steel are given up to get 15 more units of wheat.
Correct Answer

verified
Correct Answer
verified
Multiple Choice
The production possibilities curve has:
A) a positive slope which increases as we move along it from left to right.
B) a negative slope which increases as we move along it from left to right.
C) a negative slope which decreases as we move along it from left to right.
D) a negative slope which is constant as we move along it from left to right.
Correct Answer

verified
Correct Answer
verified
Multiple Choice
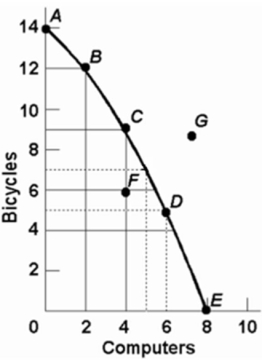
 Refer to the above diagram.The combination of computers and bicycles shown by point F:
A) is unattainable, given currently available resources and technology.
B) is attainable, but entails economic inefficiency.
C) is irrelevant because it is inconsistent with consumer preferences.
D) suggests that opportunity costs are constant.
Correct Answer

verified
Correct Answer
verified
Multiple Choice
If we say that two variables are directly related, this means that:
A) the relationship between the two is purely random.
B) an increase in one variable is associated with a decrease in the other variable.
C) an increase in one variable is associated with an increase in the other variable.
D) the two graph as a downsloping line.
Correct Answer

verified
Correct Answer
verified
Multiple Choice
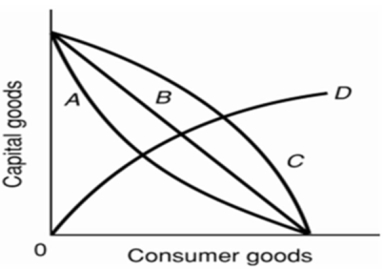
 Refer to the above diagram.Curve B is a:
A) production possibilities curve indicating constant opportunity costs.
B) production possibilities curve indicating increasing opportunity costs.
C) demand curve indicating that the quantity of consumer goods demanded increases as the price of capital falls.
D) technology frontier curve.
Correct Answer

verified
Correct Answer
verified
Showing 121 - 140 of 265
Related Exams