A) United States (population = 320 million)
B) Canada (population = 36 million)
C) China (population = 1.33 billion)
D) Russia (population = 144 million)
Correct Answer

verified
Correct Answer
verified
Multiple Choice
Often the growth cycle of one population has an effect on the cycle of another. As moose populations increase, for example, wolf populations also increase. Thus, if we are considering the logistic equation for the wolf population,  Which of the factors accounts for the effect of the moose population?
A) r
B) N
C) rN
D) K
Correct Answer

verified
Correct Answer
verified
Multiple Choice
Use the figure to answer the following question.
Life Table for Zootoca vivipara in the Netherlands
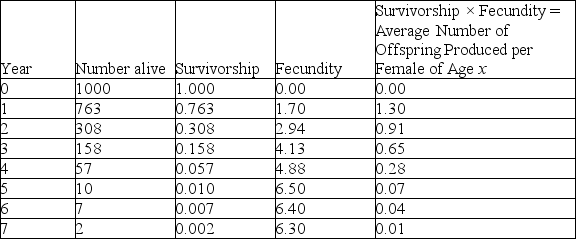 Data are from Strijbosch and Creemers, 1988.
Using the table, determine which age class year would cause the largest decline in the resulting population growth, if it were wiped out by disease.
A) age class year 1
B) age class year 2
C) age class year 3
D) age class year 4
Correct Answer

verified
A
Correct Answer
verified
Multiple Choice
Use the figure to answer the following question.
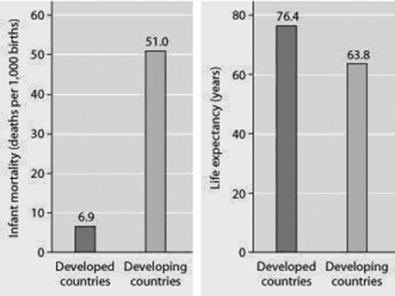 Infant mortality and life expectancy at birth in developed and developing countries (data as of 2005) .
What is a logical conclusion that can be drawn from the graphs? Developed countries have ________.
A) lower infant mortality rates and lower life expectancy than developing countries
B) higher infant mortality rates and lower life expectancy than developing countries
C) lower infant mortality rates and higher life expectancy than developing countries
D) higher infant mortality rates and higher life expectancy than developing countries
Correct Answer

verified
Correct Answer
verified
Multiple Choice
Imagine that you are managing a large game ranch. You know from historical accounts that a species of deer used to live there, but they have been extirpated. After doing some research to determine what might be an appropriately sized founding population, you reintroduce them. You then watch the population increase for several generations, and graph the number of individuals (vertical axis) against the number of generations (horizontal axis) . With no natural predators impacting the population, the graph will likely appear as ________.
A) a diagonal line, getting higher with each generation
B) an "S" that ends with a vertical line
C) an upside-down "U"
D) a "J," increasing with each generation
Correct Answer

verified
Correct Answer
verified
Multiple Choice
Which statements about K are correct? I. K varies among populations. II. K varies in space. III.K varies in time. IV.K is constant for any given species.
A) only I and III
B) only II and IV
C) only I, II, and III
D) only II, III, and IV
Correct Answer

verified
Correct Answer
verified
Multiple Choice
Use the graph to answer the following question.
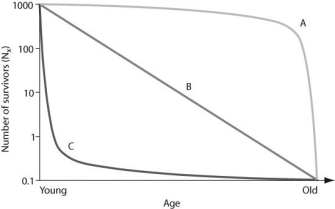 In the figure, which of the following survivorship curves most applies to humans living in developed countries?
A) curve A
B) curve B
C) curve C
D) curve A or curve B
Correct Answer

verified
Correct Answer
verified
Multiple Choice
Which of the following traits is characteristic of K-selected populations?
A) offspring with good chances of survival
B) many offspring per reproductive episode
C) small offspring
D) a high intrinsic rate of increase
Correct Answer

verified
A
Correct Answer
verified
Multiple Choice
Population ecologists follow the fate of same-age cohorts to
A) determine a population's carrying capacity.
B) determine the birth rate and death rate of each group in a population.
C) determine if a population is regulated by density-dependent processes.
D) determine the factors that affect the size of a population.
Correct Answer

verified
Correct Answer
verified
Multiple Choice
Which of the following graphs best illustrates the growth curve of a small population of rodents that has increased to a static carrying capacity?
A) ![]()
B) ![]()
C) ![]()
D) ![]()
Correct Answer

verified
Correct Answer
verified
Multiple Choice
A population's carrying capacity
A) may change as environmental conditions change.
B) can be accurately calculated using the logistic growth model.
C) increases as the per capita population growth rate decreases.
D) can never be exceeded.
Correct Answer

verified
Correct Answer
verified
Multiple Choice
Which of the following groups would be most likely to exhibit uniform dispersion?
A) red squirrels, who actively defend territories
B) cattails, which grow primarily at edges of lakes and streams
C) dwarf mistletoes, which parasitize particular species of forest tree
D) lake trout, which seek out cold, deep water high in dissolved oxygen
Correct Answer

verified
Correct Answer
verified
Multiple Choice
Use the graph to answer the following question.
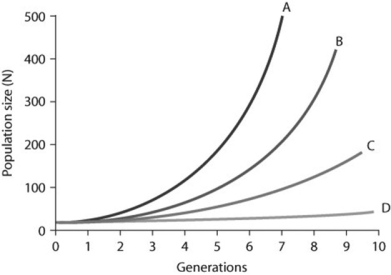 In the figure, curves A-D depict per capita rate increases (r) . Which of the following best explains the difference between the shapes of these curves?
A) The population growth is logistic as generations continue to form.
B) The growth is exponential for curves A and B, but because population growth for C and D is slower, it is considered logistic.
C) Population growth within each curve gets steeper as time passes because growth depends on both per capita rates of increase and current population size.
D) Curve A has the fastest rate of logistic growth.
Correct Answer

verified
Correct Answer
verified
Multiple Choice
Use the graphs to answer the following question.
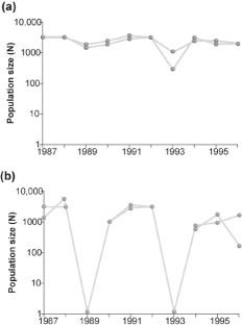 Graph (b) in the figure shows the normal fluctuations of a population of grouse, a ground-nesting bird. Assuming graph (a) in the figure is the result of some experimental treatment in the grouse population, what can be concluded?
A) The experimental treatment intensified the population cycling.
B) The experimental treatment did not affect population cycling in this species.
C) The experimental treatment has most likely identified the cause of population cycling.
D) The experimental treatment involved the introduction of a predator of the bird.
Correct Answer

verified
Correct Answer
verified
Multiple Choice
As N approaches K for a certain population, which of the following outcomes is predicted by the logistic equation?
A) The population growth rate will not change.
B) The population growth rate will approach zero.
C) The population size will increase exponentially.
D) The carrying capacity of the environment will increase.
Correct Answer

verified
Correct Answer
verified
Multiple Choice
Which of the following is the best natural example of a uniform pattern of dispersion?
A) bees collecting pollen in a wildflower meadow
B) moss spores floating in the wind to new locations of a forest
C) territorial songbirds in a mature forest during mating season
D) mushrooms growing on the floor of an old growth forest
Correct Answer

verified
D
Correct Answer
verified
Multiple Choice
Starting from a single individual, what is the size of a population of bacteria at the end of a 2-hour time period if they reproduce by binary fission every 20 minutes? (Assume unlimited resources and no mortality.)
A) 16
B) 32
C) 64
D) 128
Correct Answer

verified
Correct Answer
verified
Multiple Choice
In which of the following situations would you expect to find the largest number of r-selected individuals?
A) a recently abandoned agricultural field in Colorado
B) a sand dune community south of Lake Michigan
C) an old-growth forest with large, mature trees
D) a coral reef community off the coast of Mexico
Correct Answer

verified
Correct Answer
verified
Multiple Choice
Analyzing ecological footprints reveals that
A) Earth's carrying capacity would increase if per capita meat consumption increased.
B) current demand by industrialized countries for resources is much smaller than the ecological footprint of those countries.
C) it is not possible for technological improvements to increase Earth's carrying capacity for humans.
D) the ecological footprint of the United States is large because per capita resource use is high.
Correct Answer

verified
Correct Answer
verified
Multiple Choice
During exponential growth, a population always ________.
A) grows at its maximum per capita rate
B) quickly reaches its carrying capacity
C) adds more new individuals when the population is small than when it is large
D) loses some individuals to emigration
Correct Answer

verified
Correct Answer
verified
Showing 1 - 20 of 69
Related Exams