A) increase the value of money holdings which reduces consumption and investment spending.
B) decrease the value of money which decreases consumption and investment spending.
C) lower the real quantity of money, which causes interest rates to rise and investment to fall.
D) lead to higher interest rates which stimulate investment spending.
Correct Answer

verified
Correct Answer
verified
True/False
Aggregate expenditures that vary with real GDP are called induced aggregate expenditures.
Correct Answer

verified
Correct Answer
verified
Multiple Choice
Let AE = Aggregate Expenditures, C = Consumption, IP = Planned Investment, G = Government Purchases.Consider a simple aggregate expenditures model, where AE = C + IP + G and all components of aggregate expenditures except consumption are autonomous.All other things unchanged, an increase in the price level,
A) causes a movement up along a given aggregate expenditures curve and raises the equilibrium real GDP.
B) causes a movement down a given aggregate expenditures curve and lowers the equilibrium real GDP.
C) shifts the aggregate expenditures curve upwards and raises the equilibrium real GDP.
D) shifts the aggregate expenditures curve downwards and lowers the equilibrium real GDP.
Correct Answer

verified
Correct Answer
verified
Multiple Choice
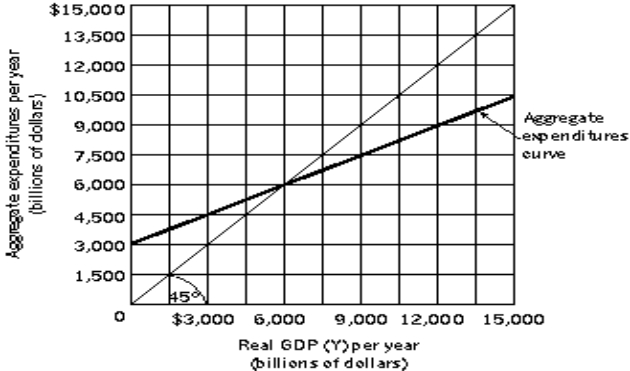
Figure 13-4
 -Refer to Figure 13-4.Let Y = real GDP, AE = Aggregate Expenditures, C = Consumption,
IP = Planned Investment.Suppose AE = C + IP.IP is autonomous and the consumption function is C = $1,000 billion + 0.5Y.If real GDP = $7,000 billion, what is the amount of aggregate expenditures?
A) $6,000 billion
B) $6,500 billion
C) $7,000 billion
D) $7,500 billion
Correct Answer

verified
Correct Answer
verified
Multiple Choice
If an economy spends 90% of any increase in real GDP, then an increase in autonomous investment of $1 billion would result ultimately in an increase in equilibrium real GDP of
A) $1.0 billion.
B) $1.9 billion.
C) $10 billion.
D) $100 billion.
Correct Answer

verified
Correct Answer
verified
Multiple Choice
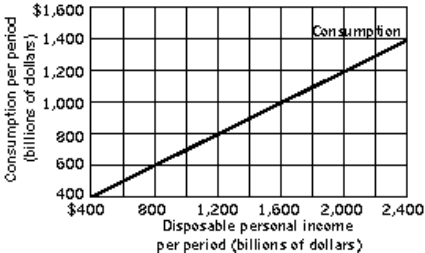
Figure 13-1
 -Refer to Figure 13-1.If disposable personal income is $400 billion, what is the amount of personal saving?
A) −$200 billion
B) $0
C) $200 billion
D) $400 billion
Correct Answer

verified
Correct Answer
verified
Multiple Choice
In a graph with real GDP on the horizontal axis and aggregate expenditures on the vertical axis, autonomous aggregate expenditures are represented by
A) a ray from the origin.
B) an upward sloping line with a positive vertical intercept.
C) a 45-degree line.
D) a horizontal line.
Correct Answer

verified
Correct Answer
verified
Multiple Choice
In the simple aggregate expenditure model where all components of aggregate expenditure are autonomous except consumption, the size of the multiplier depends on the
A) 45-degree line.
B) height of the consumption function.
C) slope of the aggregate demand curve.
D) slope of the aggregate expenditures curve.
Correct Answer

verified
Correct Answer
verified
Multiple Choice
Let AE = Aggregate Expenditures, C = Consumption, IP = Planned Investment, G = Government Purchases.Consider a simple aggregate expenditures model, where AE = C + IP + G and all components of aggregate expenditures except consumption are autonomous.All other things unchanged, a decrease in the price level
A) causes a movement up along a given aggregate expenditures curve and raises the equilibrium real GDP.
B) shifts the aggregate expenditures curve upwards and raises the equilibrium real GDP.
C) causes a movement down a given aggregate expenditures curve and lowers the equilibrium real GDP.
D) shifts the aggregate expenditures curve downwards and lowers the equilibrium real GDP.
Correct Answer

verified
Correct Answer
verified
True/False
If consumption is $80 billion when income is $100, the most likely value for the marginal propensity to consume is 0.8.
Correct Answer

verified
Correct Answer
verified
Multiple Choice
Figure 13-4
 -Refer to Figure 13-4.Let Y = real GDP, AE = Aggregate Expenditures, C = Consumption,
IP = Planned Investment.Suppose AE = C + IP, and IP is autonomous.If the level of real GDP equals $5,000 billion, and if there are no changes in the consumption function or in planned investment, then we can expect that, in the next period, real GDP will
A) rise.
B) remain unchanged.
C) fall.
D) fall, but only if there is an offsetting change in autonomous consumption.
Correct Answer

verified
Correct Answer
verified
Multiple Choice
In a graph with real GDP on the horizontal axis and aggregate expenditures on the vertical axis, induced aggregate expenditures are represented by
A) a ray from the origin.
B) an upward sloping line with a positive vertical intercept.
C) a 45-degree line.
D) a horizontal line.
Correct Answer

verified
Correct Answer
verified
Multiple Choice
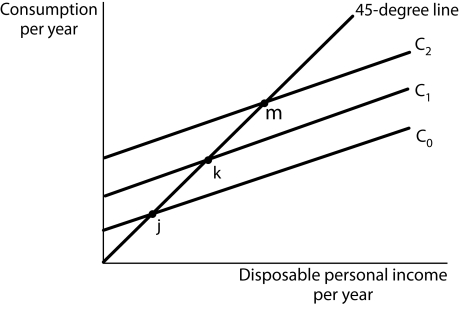
Figure 13-3
 -Refer to Figure 13-3.Upward shifts of the consumption function, for example from C0 to C1 to C2 demonstrate
A) an increase in the marginal propensity to save.
B) increases in the amount of consumption for a given level of disposable income.
C) increases in the amount of disposable income available for consumption.
D) An increase in the marginal propensity to save.
Correct Answer

verified
Correct Answer
verified
Multiple Choice
Let AE = Aggregate Expenditures, C = Consumption, IP = Planned Investment, G = Government Purchases.Consider a simple aggregate expenditures model, where AE = C + IP + G and all components of aggregate expenditures except consumption are autonomous.All other things unchanged, an increase in the price level,
A) shifts the aggregate expenditures curve upwards.
B) shifts the aggregate expenditures curve downwards.
C) causes a movement up along a given aggregate expenditures curve.
D) causes a movement down a given aggregate expenditures curve.
Correct Answer

verified
Correct Answer
verified
Multiple Choice
Disposable personal income is
A) the income households receive after paying personal taxes and personal debt.
B) the income households earn from supplying labor services for the production of aggregate output.
C) the income households receive after paying personal taxes.
D) the income households have leftover after paying personal taxes and purchasing necessities.
Correct Answer

verified
Correct Answer
verified
Multiple Choice
The saving function shows
A) the amount of saving at each level of aggregate demand, holding all other determinants of saving constant.
B) the amount of saving on at each level of disposable income, holding all other determinants of saving constant.
C) the amount of saving at each price level, holding all other determinants of saving constant.
D) the amount of saving at each wage rate, holding all other determinants of saving constant.
Correct Answer

verified
Correct Answer
verified
Multiple Choice
In general, an increase in the income tax rate will make the aggregate expenditures curve
A) steeper and the multiplier larger.
B) steeper and the multiplier smaller.
C) flatter and the multiplier larger.
D) flatter and the multiplier smaller.
Correct Answer

verified
Correct Answer
verified
Multiple Choice
The marginal propensity to consume is the
A) slope of the saving function.
B) slope of the consumption-saving curve.
C) slope of the saving-investment curve.
D) change in consumption divided by the change in disposable personal income.
Correct Answer

verified
Correct Answer
verified
Multiple Choice
Suppose the slope of the aggregate expenditures curve is 0.75.An increase in autonomous investment expenditure of $6 billion would produce an ultimate increase in equilibrium real GDP of
A) $0.25 billion.
B) $6 billion.
C) $12 billion.
D) $24 billion.
Correct Answer

verified
Correct Answer
verified
Multiple Choice
Suppose the consumption function is C = $500 + 0.8Y.If Y = $1,000, then autonomous consumption is
A) $500.
B) $800.
C) $1,000.
D) $1,300.
Correct Answer

verified
Correct Answer
verified
Showing 81 - 100 of 199
Related Exams