A) substitutes in production.
B) complements in production.
C) normal goods in production.
D) not related.
E) inputs into the same production process.
Correct Answer

verified
Correct Answer
verified
Multiple Choice
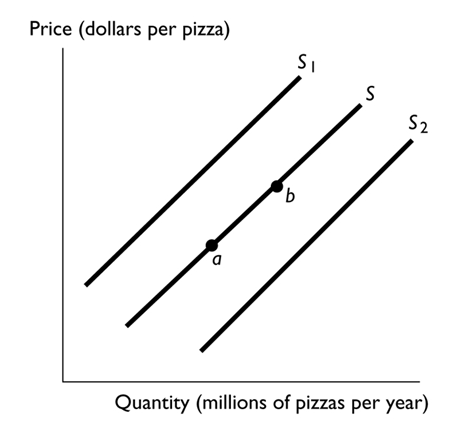 -
In the above figure, the shift in the supply curve from S to S1 reflects
A) an increase in the quantity of pizza supplied.
B) a decrease in the supply of pizza.
C) an increase in the supply of pizza.
D) a decrease in the quantity of pizza supplied.
E) None of the above answers is correct.
Correct Answer

verified
Correct Answer
verified
Multiple Choice
Which of the following definitely results in a product's equilibrium price rising?
A) a decrease in demand combined with an increase in supply
B) an increase in demand combined with a decrease in supply
C) a decrease in both demand and supply
D) an increase in both demand and supply
E) an increase in the supply combined with no change in the demand
Correct Answer

verified
Correct Answer
verified
Multiple Choice
Because of the high cost of fuel, railroads such as Union Pacific Corp and CSX Corp have increased the price they charge to haul freight. This change means that
A) the supply curve for hauling freight has shifted rightward.
B) the supply curve for hauling freight has shifted leftward.
C) the demand curve for hauling freight has shifted rightward.
D) the demand curve for hauling freight has shifted leftward.
E) neither the supply curve nor the demand curve for hauling freight has shifted; the only change is that the price is higher.
Correct Answer

verified
Correct Answer
verified
Multiple Choice
Which of the following increases the supply of a good and shifts its supply curve rightward?
A) a higher wage paid to workers in the industry
B) a smaller number of producers
C) an increase in the price of the good
D) an increase in the cost of the resources used to produce the good
E) a technological advance in how the good is produced
Correct Answer

verified
Correct Answer
verified
Multiple Choice
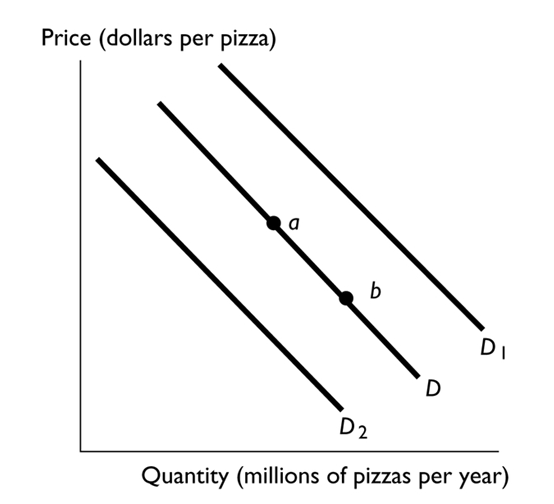 -
In the above figure, the shift in the demand curve from D to D1 can be the result of
A) an increase in the number of teenagers, all of whom demand more pizza than do other age groups.
B) an increase in the price of soda, a complement to pizza.
C) new technology that increases the profit from producing pizza.
D) a decrease in income if pizza is a normal good.
E) a decrease in the price of a sub sandwich, a substitute for pizza.
Correct Answer

verified
Correct Answer
verified
Multiple Choice
An increase in the number of fast-food restaurants
A) increases the supply of fast-food meals.
B) increases the demand for substitutes for fast-food meals.
C) increases both the demand and supply of fast-food meals.
D) raises the price of fast-food meals.
E) increases the demand for fast-food meals.
Correct Answer

verified
Correct Answer
verified
Multiple Choice
Other things remaining the same, the quantity of a good or service demanded will increase if the price of the good or service
A) rises or falls.
B) rises or does not change.
C) does not change.
D) rises.
E) falls.
Correct Answer

verified
Correct Answer
verified
Multiple Choice
Which of the following results in a movement upward along the supply curve for movies in theaters?
A) an increase in the price of movie tickets
B) a decrease in the price of downloaded movies
C) a decrease in movie star salaries
D) an increase in the number of theaters
E) a decrease in the price of movie tickets
Correct Answer

verified
Correct Answer
verified
Multiple Choice
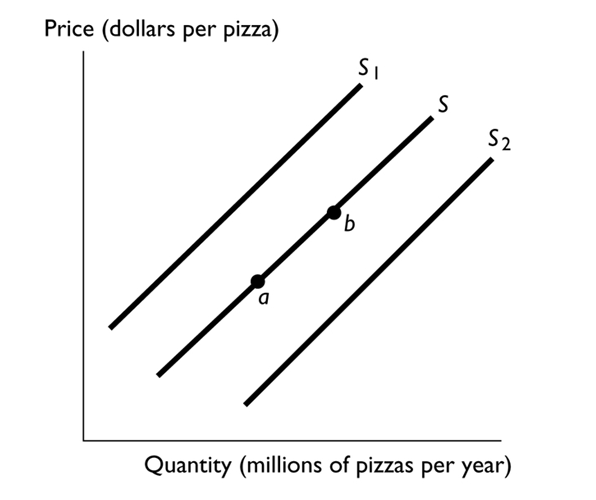 -
In the above figure, the shift in the supply curve from S to S2 reflects
A) a decrease in the supply of pizza.
B) an increase in the supply of pizza.
C) an increase in the quantity of pizza supplied.
D) a decrease in the quantity of pizza supplied.
E) a decrease in the supply of pizza and a simultaneous decrease in the quantity of pizza supplied.
Correct Answer

verified
Correct Answer
verified
Multiple Choice
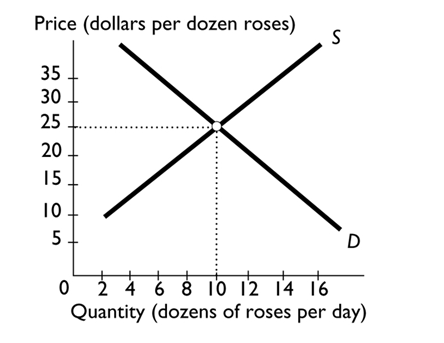 -
In the figure above, a price of $15 per dozen roses results in
A) a surplus.
B) equilibrium.
C) downward pressure on the price of roses.
D) a shortage.
E) an eventual leftward shift of the demand curve and/or rightward shift of the supply curve.
Correct Answer

verified
Correct Answer
verified
Multiple Choice
Using the data in the table above, if the price of a stapler is $8, then there is a of staplers and the quantity of staplers demanded the quantity of staplers supplied.
A) surplus; is greater than
B) neither a surplus nor a shortage; equals
C) surplus; is less than
D) shortage; is greater than
E) shortage; is less than
Correct Answer

verified
Correct Answer
verified
Multiple Choice
 -
The above figures show the market for HD televisions. If more firms start to produce HD televisions , which figure shows the effect of this change?
A) Figure A
B) Figure B
C) Figure C
D) Figure D
E) None of the figures represent this change.
Correct Answer

verified
Correct Answer
verified
Multiple Choice
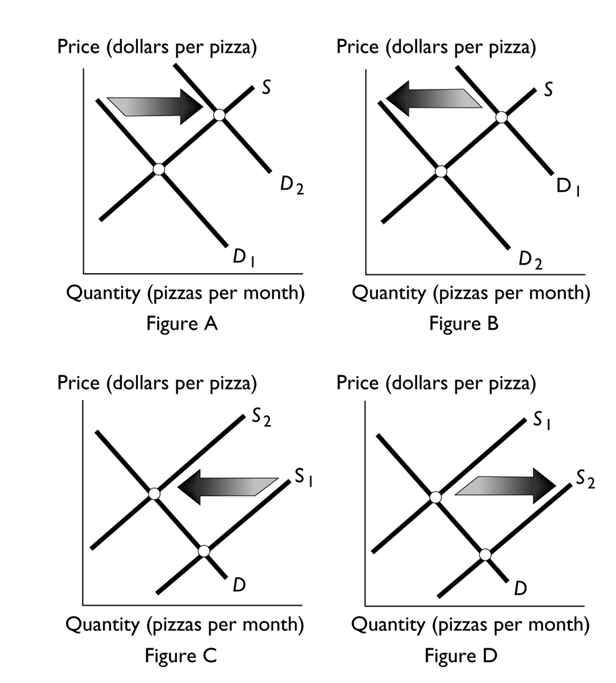 -
Which figure above shows the effect of a technological advance in the production of pizza?
A) Figure A
B) Figure B
C) Figure C
D) Figure D
E) Both Figure A and Figure D
Correct Answer

verified
Correct Answer
verified
Multiple Choice
Ramen noodles are a staple food item for many college students. Ramen noodles are very inexpensive, easy to prepare, and can be combined easily with other foods. After students graduate, find employment, and earn a higher income, they decrease their Ramen noodle purchases significantly. In this case, Ramen noodles are
A) a normal good.
B) a substitute good.
C) an inferior good.
D) a complement for higher income people.
E) None of the above answers is correct.
Correct Answer

verified
Correct Answer
verified
Multiple Choice
To be part of the supply for a good, a producer must be
A) only willing to supply the good.
B) only able to supply the good.
C) both able and willing to supply the good.
D) both able and willing to supply the good, and have already identified a buyer.
E) both able and willing to supply the good, and have already sold the good.
Correct Answer

verified
Correct Answer
verified
Multiple Choice
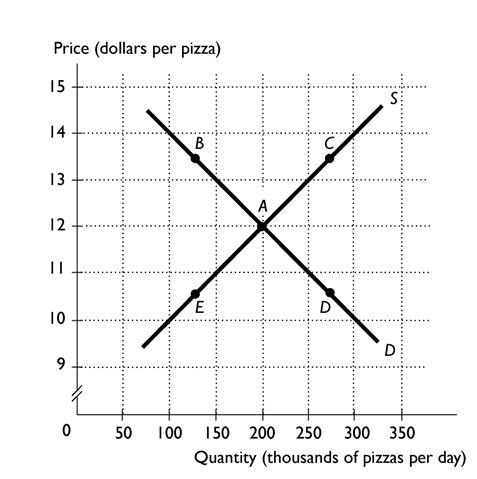 -
The above figure shows the market for pizza. The market is in equilibrium when the cheese used to produce pizza falls in price. What point represents the most likely new price and quantity?
A) A
B) B
C) C
D) D
E) E
Correct Answer

verified
Correct Answer
verified
Multiple Choice
Consumers eat salsa with taco chips. The price of salsa rises. How does the increase in the price of Salsa affect the demand for taco chips?
A) It increases the demand for taco chips.
B) It decreases the demand for taco chips.
C) It has no effect on the demand for taco chips.
D) It will decrease the demand for taco chips only if taco chips are a normal good.
E) It could increase, decrease, or have no effect on the demand for taco chips, but more information is needed to determine the impact.
Correct Answer

verified
Correct Answer
verified
Multiple Choice
Consider the market for peanut butter. If there is a decrease in the price of deli turkey slices (a substitute in consumption for peanut butter) along with a decrease in the price of peanut brittle (a substitute in production for peanut butter) , the
A) equilibrium quantity of peanut butter definitely increases.
B) equilibrium price of peanut butter might rise or fall.
C) equilibrium quantity of peanut definitely decreases.
D) equilibrium price of peanut butter definitely rises.
E) equilibrium price of peanut butter definitely falls.
Correct Answer

verified
Correct Answer
verified
Multiple Choice
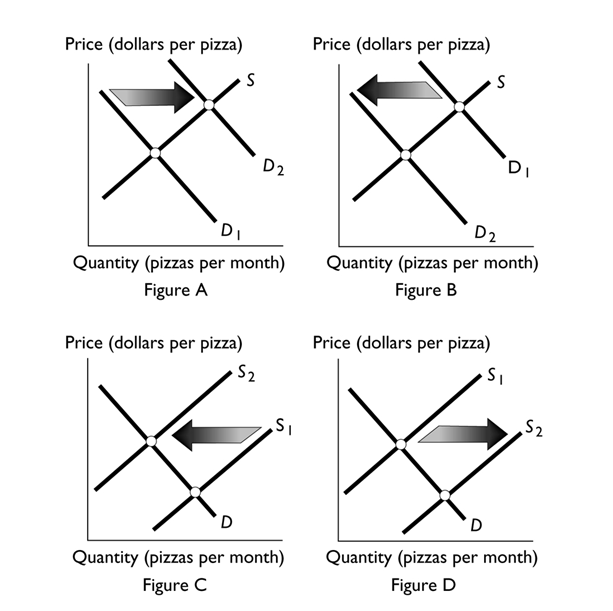 -
Which figure above shows the effect if research is published claiming that eating pizza is healthy?
A) Figure A
B) Figure B
C) Figure C
D) Figure D
E) Both Figure A and Figure D
Correct Answer

verified
Correct Answer
verified
Showing 121 - 140 of 140
Related Exams