Filters
Question type

Study Flashcards

Graph the equation by plotting points. - y=7xy=|7-x|  Graph the equation by plotting points. - y=|7-x|     A)    B)    C)    D)


A)
 Graph the equation by plotting points. - y=|7-x|     A)    B)    C)    D)
B)
 Graph the equation by plotting points. - y=|7-x|     A)    B)    C)    D)
C)
 Graph the equation by plotting points. - y=|7-x|     A)    B)    C)    D)
D)
 Graph the equation by plotting points. - y=|7-x|     A)    B)    C)    D)

Correct Answer

verifed

verified

Determine the intervals of the domain for which the function is increasing, decreasing, and constant. - Determine the intervals of the domain for which the function is increasing, decreasing, and constant. -  A)  Increasing  [ 1 , \infty )  ; Decreasing  ( - \infty , 1 ]  B)  Increasing  [ - 1 , \infty )  ; Decreasing  ( - \infty , - 1 ]  C)  Increasing  ( - \infty , 1 ] ; Decreasing  [ 1 , \infty )   D)  Increasing  ( - \infty , - 1 ] ; Decreasing  [ - 1 , \infty )


A) Increasing [1,) [ 1 , \infty ) ; Decreasing (,1]( - \infty , 1 ]
B) Increasing [1,) [ - 1 , \infty ) ; Decreasing (,1]( - \infty , - 1 ]
C) Increasing (,1]( - \infty , 1 ] ; Decreasing [1,) [ 1 , \infty )
D) Increasing (,1]( - \infty , - 1 ] ; Decreasing [1,) [ - 1 , \infty )

Correct Answer

verifed

verified

Evaluate the function. -Find f(0) f ( 0 ) if f={(2,3) ,(3,0) ,(0,5) ,(5,2) }f = \{ ( - 2,3 ) , ( 3,0 ) , ( 0,5 ) , ( 5 , - 2 ) \}


A) (5,3) ( 5,3 )
B) 3
C) None of these
D) 5

Correct Answer

verifed

verified

Graph the function. - f(x) =x1f(x) =\llbracket x-1 \rrbracket  Graph the function. - f(x) =\llbracket x-1 \rrbracket     A)    B)    C)    D)


A)
 Graph the function. - f(x) =\llbracket x-1 \rrbracket     A)    B)    C)    D)
B)
 Graph the function. - f(x) =\llbracket x-1 \rrbracket     A)    B)    C)    D)
C)
 Graph the function. - f(x) =\llbracket x-1 \rrbracket     A)    B)    C)    D)
D)
 Graph the function. - f(x) =\llbracket x-1 \rrbracket     A)    B)    C)    D)

Correct Answer

verifed

verified

Graph the function. - g(x) =(x2) 34g ( x ) = - ( x - 2 ) ^ { 3 } - 4  Graph the function. - g ( x )  = - ( x - 2 )  ^ { 3 } - 4    A)    B)    C)    D)


A)
 Graph the function. - g ( x )  = - ( x - 2 )  ^ { 3 } - 4    A)    B)    C)    D)
B)
 Graph the function. - g ( x )  = - ( x - 2 )  ^ { 3 } - 4    A)    B)    C)    D)
C)
 Graph the function. - g ( x )  = - ( x - 2 )  ^ { 3 } - 4    A)    B)    C)    D)
D)
 Graph the function. - g ( x )  = - ( x - 2 )  ^ { 3 } - 4    A)    B)    C)    D)

Correct Answer

verifed

verified

For the given functions f and g , find the indicated composition. - f(x) =x+5,g(x) =7xf ( x ) = \sqrt { x + 5 } , \quad g ( x ) = - \frac { 7 } { x } (gf) (x) ( g \circ f ) ( x )


A) 7x+5\frac { 7 } { \sqrt { - x + 5 } }
B) 7x+5\sqrt { - \frac { 7 } { x } + 5 }
C) 17x+5- \frac { 1 } { \sqrt { 7 x + 5 } }
D) 7x+5- \frac { 7 } { \sqrt { x + 5 } }

Correct Answer

verifed

verified

Graph the linear function and give the domain and the range. If the function is a constant function, identify it as such. - f(x) =2x3f(x) =-2 x-3  Graph the linear function and give the domain and the range. If the function is a constant function, identify it as such. - f(x) =-2 x-3    A)   D=(-\infty, \infty) , \quad R=(-\infty, \infty)     B)  D=(-\infty, \infty) , \quad R=(-\infty, \infty)     C)  D=(-\infty, \infty) , \quad R=(-\infty, \infty)     D)  \mathrm{D}=(-\infty, \infty) , \mathrm{R}=(-\infty, \infty)
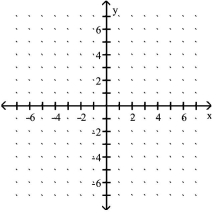

A) D=(,) ,R=(,) D=(-\infty, \infty) , \quad R=(-\infty, \infty)
 Graph the linear function and give the domain and the range. If the function is a constant function, identify it as such. - f(x) =-2 x-3    A)   D=(-\infty, \infty) , \quad R=(-\infty, \infty)     B)  D=(-\infty, \infty) , \quad R=(-\infty, \infty)     C)  D=(-\infty, \infty) , \quad R=(-\infty, \infty)     D)  \mathrm{D}=(-\infty, \infty) , \mathrm{R}=(-\infty, \infty)
B) D=(,) ,R=(,) D=(-\infty, \infty) , \quad R=(-\infty, \infty)
 Graph the linear function and give the domain and the range. If the function is a constant function, identify it as such. - f(x) =-2 x-3    A)   D=(-\infty, \infty) , \quad R=(-\infty, \infty)     B)  D=(-\infty, \infty) , \quad R=(-\infty, \infty)     C)  D=(-\infty, \infty) , \quad R=(-\infty, \infty)     D)  \mathrm{D}=(-\infty, \infty) , \mathrm{R}=(-\infty, \infty)
C) D=(,) ,R=(,) D=(-\infty, \infty) , \quad R=(-\infty, \infty)
 Graph the linear function and give the domain and the range. If the function is a constant function, identify it as such. - f(x) =-2 x-3    A)   D=(-\infty, \infty) , \quad R=(-\infty, \infty)     B)  D=(-\infty, \infty) , \quad R=(-\infty, \infty)     C)  D=(-\infty, \infty) , \quad R=(-\infty, \infty)     D)  \mathrm{D}=(-\infty, \infty) , \mathrm{R}=(-\infty, \infty)
D) D=(,) ,R=(,) \mathrm{D}=(-\infty, \infty) , \mathrm{R}=(-\infty, \infty)
 Graph the linear function and give the domain and the range. If the function is a constant function, identify it as such. - f(x) =-2 x-3    A)   D=(-\infty, \infty) , \quad R=(-\infty, \infty)     B)  D=(-\infty, \infty) , \quad R=(-\infty, \infty)     C)  D=(-\infty, \infty) , \quad R=(-\infty, \infty)     D)  \mathrm{D}=(-\infty, \infty) , \mathrm{R}=(-\infty, \infty)

Correct Answer

verifed

verified

Graph the point symmetric to the given point. -Plot the point (-8, 0) , then plot the point that is symmetric to (-8, 0) with respect to the x-axis. Graph the point symmetric to the given point. -Plot the point (-8, 0) , then plot the point that is symmetric to (-8, 0)  with respect to the x-axis.    A)    B)    C)    D)
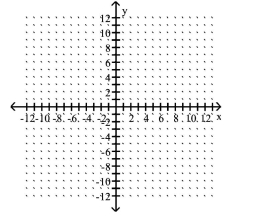

A)
Graph the point symmetric to the given point. -Plot the point (-8, 0) , then plot the point that is symmetric to (-8, 0)  with respect to the x-axis.    A)    B)    C)    D)
B)
Graph the point symmetric to the given point. -Plot the point (-8, 0) , then plot the point that is symmetric to (-8, 0)  with respect to the x-axis.    A)    B)    C)    D)
C)
Graph the point symmetric to the given point. -Plot the point (-8, 0) , then plot the point that is symmetric to (-8, 0)  with respect to the x-axis.    A)    B)    C)    D)
D)
Graph the point symmetric to the given point. -Plot the point (-8, 0) , then plot the point that is symmetric to (-8, 0)  with respect to the x-axis.    A)    B)    C)    D)

Correct Answer

verifed

verified

Find the center-radius form of the equation of the circle. -center (0,10) ( 0 , - 10 ) , radius 6


A) x2+(y+10) 2=36x ^ { 2 } + ( y + 10 ) ^ { 2 } = 36
B) (x10) 2+y2=36( x - 10 ) ^ { 2 } + y ^ { 2 } = 36
C) (x+10) 2+y2=36( x + 10 ) ^ { 2 } + y ^ { 2 } = 36
D) x2+(y10) 2=6x ^ { 2 } + ( y - 10 ) ^ { 2 } = 6

Correct Answer

verifed

verified

Graph the function. - y=x5y=\sqrt{x-5}  Graph the function. - y=\sqrt{x-5}    A)    B)    C)    D)


A)
 Graph the function. - y=\sqrt{x-5}    A)    B)    C)    D)
B)
 Graph the function. - y=\sqrt{x-5}    A)    B)    C)    D)
C)
 Graph the function. - y=\sqrt{x-5}    A)    B)    C)    D)
D)
 Graph the function. - y=\sqrt{x-5}    A)    B)    C)    D)

Correct Answer

verifed

verified

Give the domain and range of the relation. - y=6+xy = \sqrt { 6 + x }


A) domain: (,) ( - \infty , \infty ) ; range: [6,) [ - 6 , \infty )
B) domain: [6,) [ - 6 , \infty ) ; range: [0,) [ 0 , \infty )
C) domain: (,) ( - \infty , \infty ) ; range: (,) ( - \infty , \infty )
D) domain: [0,) [ 0 , \infty ) ; range: (,) ( - \infty , \infty )

Correct Answer

verifed

verified

Graph the point symmetric to the given point. -Plot the point (-4, 5) , then plot the point that is symmetric to (-4, 5) with respect to the y-axis. Graph the point symmetric to the given point. -Plot the point (-4, 5) , then plot the point that is symmetric to (-4, 5)  with respect to the y-axis.    A)    B)    C)    D)
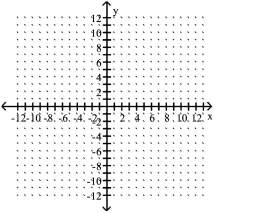

A)
Graph the point symmetric to the given point. -Plot the point (-4, 5) , then plot the point that is symmetric to (-4, 5)  with respect to the y-axis.    A)    B)    C)    D)
B)
Graph the point symmetric to the given point. -Plot the point (-4, 5) , then plot the point that is symmetric to (-4, 5)  with respect to the y-axis.    A)    B)    C)    D)
C)
Graph the point symmetric to the given point. -Plot the point (-4, 5) , then plot the point that is symmetric to (-4, 5)  with respect to the y-axis.    A)    B)    C)    D)
D)
Graph the point symmetric to the given point. -Plot the point (-4, 5) , then plot the point that is symmetric to (-4, 5)  with respect to the y-axis.    A)    B)    C)    D)

Correct Answer

verifed

verified

Decide whether the relation defines a function. - Decide whether the relation defines a function. -  A)  \text { Not a function }  B)  Function
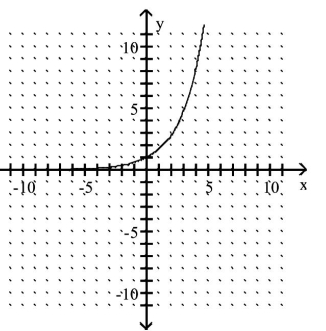

A)  Not a function \text { Not a function }
B) Function

Correct Answer

verifed

verified

Find the average rate of change illustrated in the graph. - Find the average rate of change illustrated in the graph. -   A)   \$ 0.50  per minute B)   \$ 4.00  per minute C)   \$ 2.00  per minute D)   \$ 0.25  per minute
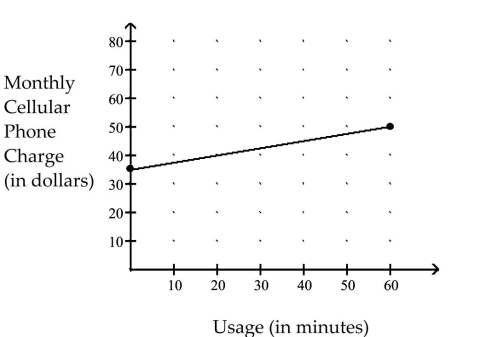

A) $0.50\$ 0.50 per minute
B) $4.00\$ 4.00 per minute
C) $2.00\$ 2.00 per minute
D) $0.25\$ 0.25 per minute

Correct Answer

verifed

verified

An equation that defines y as a function of x is given. Solve for y in terms of x, and replace y with the function notation f(x) . - y4x2=2xy - 4 x ^ { 2 } = 2 - x


A) f(x) =4x2x+2f ( x ) = - 4 x ^ { 2 } - x + 2
B) f(x) =4x2+x+2f ( x ) = 4 x ^ { 2 } + x + 2
C) f(x) =4x2+x2f ( x ) = - 4 x ^ { 2 } + x - 2
D) f(x) =4x2x+2f ( x ) = 4 x ^ { 2 } - x + 2

Correct Answer

verifed

verified

Graph the line described. -through (0,5) ;m=5( 0,5 ) ; \mathrm { m } = - 5  Graph the line described. -through  ( 0,5 )  ; \mathrm { m } = - 5     A)    B)    C)    D)


A)
 Graph the line described. -through  ( 0,5 )  ; \mathrm { m } = - 5     A)    B)    C)    D)
B)
 Graph the line described. -through  ( 0,5 )  ; \mathrm { m } = - 5     A)    B)    C)    D)
C)
 Graph the line described. -through  ( 0,5 )  ; \mathrm { m } = - 5     A)    B)    C)    D)
D)
 Graph the line described. -through  ( 0,5 )  ; \mathrm { m } = - 5     A)    B)    C)    D)

Correct Answer

verifed

verified

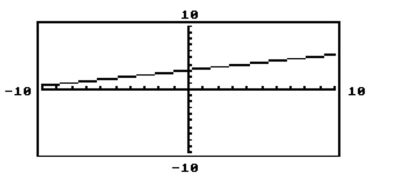
Use a graphing calculator to solve the linear equation. -The graph of y1y _ { 1 } is shown in the standard viewing window. Which is the only choice that could possibly be the solution of the equation y1=0\mathrm { y } _ { 1 } = 0 ?  Use a graphing calculator to solve the linear equation. -The graph of  y _ { 1 }  is shown in the standard viewing window. Which is the only choice that could possibly be the solution of the equation  \mathrm { y } _ { 1 } = 0  ?     - 12 , - 7 , - \frac { 13 } { 4 } , 12  A)  12 B)   - 12  C)   - 7  D)   - \frac { 13 } { 4 } 12,7,134,12- 12 , - 7 , - \frac { 13 } { 4 } , 12


A) 12
B) 12- 12
C) 7- 7
D) 134- \frac { 13 } { 4 }

Correct Answer

verifed

verified

Graph the function. - y=3x8y=3|x|-8  Graph the function. - y=3|x|-8    A)    B)    C)    D)


A)
 Graph the function. - y=3|x|-8    A)    B)    C)    D)
B)
 Graph the function. - y=3|x|-8    A)    B)    C)    D)
C)
 Graph the function. - y=3|x|-8    A)    B)    C)    D)
D)
 Graph the function. - y=3|x|-8    A)    B)    C)    D)

Correct Answer

verifed

verified

Find the slope of the line satisfying the given conditions. -horizontal, through (1,9) ( 1 , - 9 )


A) 0
B) -1
C) 1
D) undefined

Correct Answer

verifed

verified

Describe how the graph of the equation relates to the graph of y = x2. - f(x) =x2+4f ( x ) = x ^ { 2 } + 4


A) a translation 4 units to the left
B) a translation 4 units to the right
C) a translation 4 units down
D) a translation 4 units up

Correct Answer

verifed

verified

Showing 361 - 380 of 525

Related Exams

Show Answer