Correct Answer

verified
Correct Answer
verified
Multiple Choice
After you create a PivotTable report, you can analyze the information in a different form by generating an associated ____, which contains the same elements as a regular Excel chart.
A) ScenarioChart
B) PivotChart
C) Data Chart
D) Data File
Correct Answer

verified
Correct Answer
verified
Multiple Choice
Although you can use generic names for your scenarios, you should use more descriptive names because they appear on any scenario summary reports you ____.
A) create
B) print
C) both a and b
D) neither a nor b
Correct Answer

verified
C
Correct Answer
verified
Multiple Choice
A contribution margin is calculated by subtracting variable expenses from sales, and represents the amount of revenue that contributes to covering the ____ expenses of a company.
A) variable
B) fixed
C) tax
D) accounts payable
Correct Answer

verified
Correct Answer
verified
True/False
The contribution margin represents the amount of revenue that can contribute to covering the fixed expenses of a company. _________________________
Correct Answer

verified
Correct Answer
verified
Multiple Choice
Identify the letter of the choice that best matches the word or phrase with its definition. -Data table cells containing values that can vary
A) changing cells
B) result cells
C) one-variable data table
D) data table
E) input cells
F) two-variable data table
G) range name
Correct Answer

verified
E
Correct Answer
verified
Multiple Choice
Because you can compare the results of many calculations in data tables, they can be very useful when performing a ____ analysis.
A) break-even
B) sensitivity
C) both a and b
D) neither a nor b
Correct Answer

verified
Correct Answer
verified
Multiple Choice
Break-even analysis is a type of what-if analysis that concentrates on an activity at or around the point at which a product breaks even-or where the ____ is $0.
A) profit
B) cost
C) income
D) COGS
Correct Answer

verified
Correct Answer
verified
True/False
You can omit taxes from your estimates, or use your marginal tax rate.
Correct Answer

verified
Correct Answer
verified
Short Answer
Both one-variable data tables and two-variable data tables have ____________________ cells, which contain formulas that involve the input cells in their calculations in some way.
Correct Answer

verified
result
Correct Answer
verified
True/False
What-if analysis allows you to see what output results if the values of various input assumptions change.
Correct Answer

verified
Correct Answer
verified
True/False
To set up a scenario, you create or use a worksheet that contains sets of input cells and no output cells.
Correct Answer

verified
Correct Answer
verified
Short Answer
A defined name can have a scope for the entire workbook, which is referred to as the ____________________ level.
Correct Answer

verified
Correct Answer
verified
Multiple Choice
If a company decides to use income tax expense as a factor in analyses, a method it could use to compute the effects is ____.
A) rules based on Generally Accepted Accounting Principles (GAAP)
B) tax-basis rules
C) either a or b
D) neither a nor b
Correct Answer

verified
Correct Answer
verified
Multiple Choice
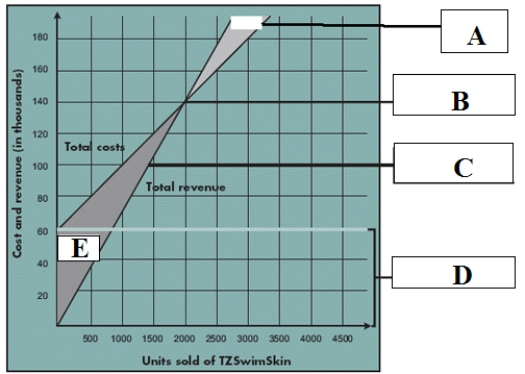
MATCHING
 Identify the letter of the choice that best matches the break-even point in the chart above.
-Loss
A) A
B) B
C) C
D) D
E) E
Correct Answer

verified
Correct Answer
verified
Multiple Choice
Data tables can be used to give you ____.
A) break-even information
B) information about the interaction of various selling prices
C) information about how sensitive profits are to price changes
D) all of the above
Correct Answer

verified
Correct Answer
verified
Multiple Choice
In a two-variable data table, you can vary the values of two input variables, and show the results for ____ output value(s) .
A) one
B) two
C) one or two
D) two or more
Correct Answer

verified
Correct Answer
verified
Multiple Choice
Although a PivotTable usually summarizes information into different categories using functions such as ____, a scenario PivotTable lets you summarize the result cells from a scenario.
A) COUNT
B) AVERAGE
C) MAX
D) all of the above
Correct Answer

verified
Correct Answer
verified
Multiple Choice
Using ____ can make the process of creating scenarios and using them easier.
A) range names
B) cell names
C) row names
D) column names
Correct Answer

verified
Correct Answer
verified
Multiple Choice
If a business problem involved three break-even analyses, you could create ____ data table(s) by varying the unit price and sales projection values, but that would involve generating and printing each data table to compare the analyses.
A) one
B) two different
C) three different
D) three identical
Correct Answer

verified
Correct Answer
verified
Showing 1 - 20 of 150
Related Exams