A) rises; increases
B) falls; increases
C) rises; decreases
D) falls; decreases
E) does not change; decreases
Correct Answer

verified
Correct Answer
verified
Multiple Choice
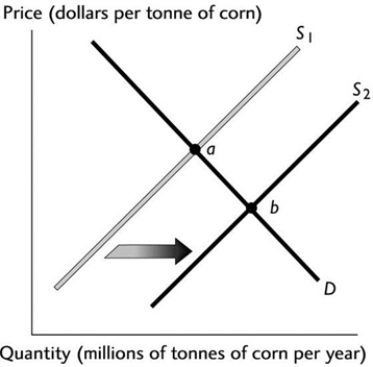 The above figure illustrates the market for corn. If point 'a' represents the original equilibrium and point 'b' the new equilibrium, which of the following could have caused the change?
A) An increase in consumers' preferences for corn.
B) An increase in the labour costs of producing corn.
C) An increase in consumers' income if corn is a normal good.
D) An improvement in the technology of producing corn.
E) An increase in consumers' income if corn is an inferior good.
Correct Answer

verified
Correct Answer
verified
Multiple Choice
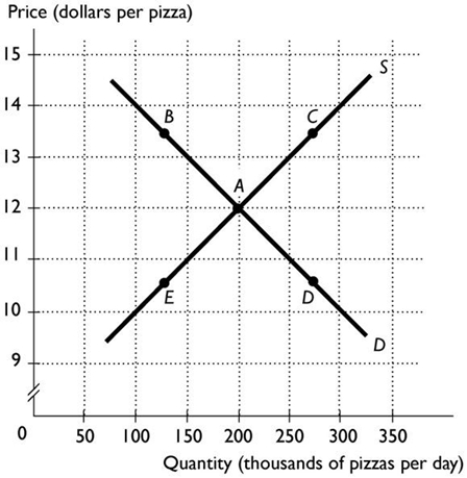 The above figure shows the market for pizza. The market is in equilibrium when people's incomes decrease. If pizza is a normal good, then which point represents the most likely new price and quantity?
A) A
B) B
C) C
D) D
E) E
Correct Answer

verified
Correct Answer
verified
Multiple Choice
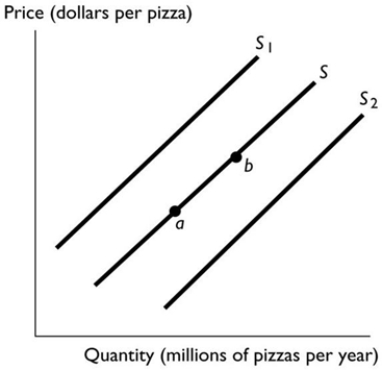 In the above figure, the shift in the supply curve from S to S1 reflects
A) an increase in the quantity of pizza supplied.
B) a decrease in the supply of pizza.
C) an increase in the supply of pizza.
D) a decrease in the quantity of pizza supplied.
E) None of the above answers is correct.
Correct Answer

verified
Correct Answer
verified
Multiple Choice
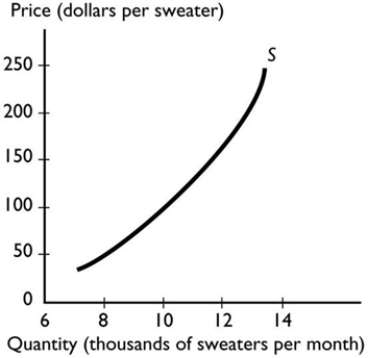 The graph illustrates the supply of sweaters. As the technology used to produce sweaters improves, the
A) quantity of sweaters supplied decreases.
B) quantity of sweaters supplied increases.
C) supply of sweaters decreases and the demand for sweaters does not change.
D) supply of sweaters increases AND the demand for sweaters increases.
E) supply of sweaters increases and the demand for sweaters does not change.
Correct Answer

verified
Correct Answer
verified
Multiple Choice
If the Motor Vehicle Builders' Union successfully negotiates a wage increase for its members, how does the wage hike affect the supply of cars?
A) The quantity supplied decreases.
B) The supply increases.
C) The supply decreases.
D) The quantity supplied increases.
E) Both answers B and D are correct.
Correct Answer

verified
Correct Answer
verified
Multiple Choice
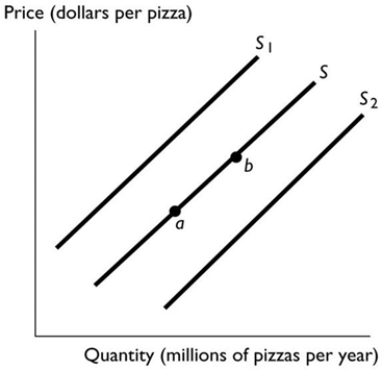 In the above figure, an increase in cost of the cheese used to produce pizza
A) results in a movement from point b to point a.
B) results in a movement from point a to point b.
C) shifts the supply curve from S to S2.
D) shifts the supply curve from S to S1.
E) has no effect.
Correct Answer

verified
Correct Answer
verified
Multiple Choice
An increase in both the equilibrium price and quantity can be the result of
A) a decrease in supply.
B) a decrease in demand.
C) an increase in supply.
D) an increase in demand.
E) None of the above answers is correct.
Correct Answer

verified
Correct Answer
verified
Multiple Choice
If both producers and consumers believe that a product's price will rise in the future, then in the present, the equilibrium price
A) might rise, fall or not change, but the change can never be predicted.
B) might rise, fall or not change depending on whether the effect from the producers is greater or less than the effect from the consumers.
C) falls.
D) rises.
E) does not change.
Correct Answer

verified
Correct Answer
verified
Multiple Choice
Petrol prices increase by 50 per cent and other things remain the same. As a result, there is
A) an increase in the demand for petrol.
B) a decrease in the quantity of petrol demanded.
C) a decrease in the demand for petrol.
D) no change in the quantity of petrol demanded.
E) More information is needed to determine if the demand for petrol increases or decreases.
Correct Answer

verified
Correct Answer
verified
Multiple Choice
Teenagers drink more soft drinks than other age groups. If the number of teenagers increases, everything else remaining the same,
A) market demand for soft drinks decreases.
B) market demand for soft drinks does not change.
C) there is a movement along the market demand curve for soft drinks.
D) market demand for soft drinks increases.
E) None of the above answers is correct because the effect on demand depends whether the supply curve shifts rightward, leftward or not at all.
Correct Answer

verified
Correct Answer
verified
Multiple Choice
The law of demand refers to how
A) the price of the good changes when people's demand for the good changes.
B) demand changes when people's incomes change.
C) the quantity demanded changes when the demand for the good changes.
D) the quantity demanded changes when the price of the good changes.
E) demand changes when the prices of substitutes and complements change.
Correct Answer

verified
Correct Answer
verified
Multiple Choice
Consider the market for smart phones. Which of the following shifts the demand curve rightward?
A) A decrease in the number of smart phone buyers.
B) An increase in the price of smart phones.
C) A decrease in the price of smart phones.
D) An increase in the supply of smart phones.
E) An increase in the price of land-line phone service, a substitute for smart phones.
Correct Answer

verified
Correct Answer
verified
Multiple Choice
Suppose the equilibrium price of oranges is $2.00 per kilogram. If the actual price is above the equilibrium price, a
A) surplus exists but nothing happens until either the demand or the supply changes.
B) surplus exists and the price rises to restore equilibrium.
C) shortage exists and the price rises to restore equilibrium.
D) surplus exists and the price falls to restore equilibrium.
E) shortage exists and the price falls to restore equilibrium.
Correct Answer

verified
Correct Answer
verified
Multiple Choice
The market demand curve
A) cannot show a change in demand for a good.
B) is upward sloping.
C) is the vertical sum of individual demand curves.
D) cannot show how quantity demanded changes in response to a change in price.
E) is the horizontal sum of individual demand curves.
Correct Answer

verified
Correct Answer
verified
Multiple Choice
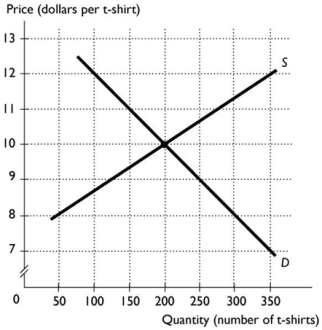 The above figure shows the market for t-shirts. If the price of t-shirts is $12, then
A) there is a shortage and the price of t-shirts will fall.
B) there is a surplus and the price of t-shirts will rise.
C) there is a surplus and the price of t-shirts will fall.
D) there is a shortage and the price of t-shirts will rise.
E) the market is in equilibrium.
Correct Answer

verified
Correct Answer
verified
Multiple Choice
Suppose the demand curve for desktop computers shifts rightward and at the same time the supply curve shifts leftward. Which of the following could have caused these shifts?
A) Consumers purchased more computers because of the Christmas season, and the labour costs of producing desktop computers decreased.
B) Desktop computers are a normal good and incomes increased, while the labour costs of producing personal computers increased.
C) The price of a laptop computer, a substitute for desktop computers, fell and the cost of producing desktop computers decreased.
D) Desktop computers are a normal good and incomes decreased, while the labour costs of producing personal computers increased.
E) Desktop computers are a normal good and incomes increased, while more firms entered the market.
Correct Answer

verified
Correct Answer
verified
Multiple Choice
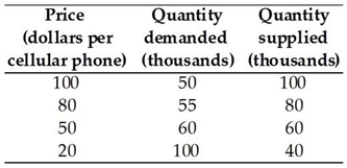 -Using the data in the table above, the equilibrium quantity and equilibrium price for a cellular smart phone is
A) 60,000 and $50.
B) 80,000 and $80.
C) 40,000 and $20.
D) 50,000 and $100.
E) 100,000 and $20.
Correct Answer

verified
Correct Answer
verified
Multiple Choice
A market is defined as
A) a physical place where people buy only goods.
B) any arrangement that brings buyers and sellers together.
C) a place where one good is bartered for another.
D) a physical place where people buy both goods and services.
E) a store where people buy physical goods.
Correct Answer

verified
Correct Answer
verified
Multiple Choice
There are five hundred buyers in the market for cheese. If we know each individual's demand curves, to find the market demand we must
A) add the prices that each buyer will pay at every quantity.
B) add the quantities that each buyer will purchase at every price.
C) give up because there is no way to find the market demand.
D) average the price each buyer is willing to pay for each given quantity.
E) multiply the price times quantity for each buyer and then add the resulting products together.
Correct Answer

verified
Correct Answer
verified
Showing 81 - 100 of 139
Related Exams