A) equal to level 2.
B) less than level 2.
C) greater than level 2.
D) equal to level 3.
Correct Answer

verified
Correct Answer
verified
Multiple Choice
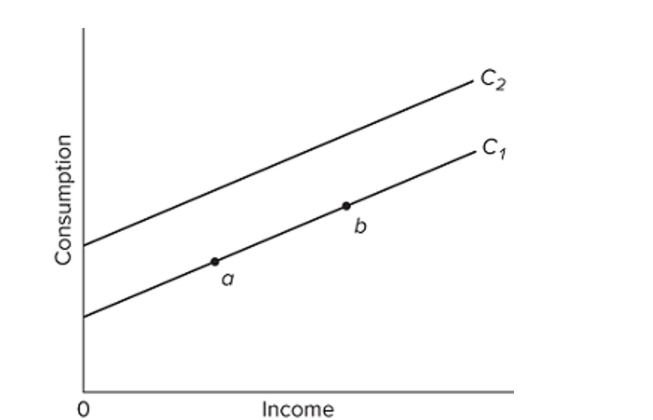 Refer to the given graph. A movement from a to b along C1 might be caused by a(n)
A) recession.
B) wealth effect of an increase in stock market prices.
C) increase in income tax rates.
D) increase in real GDP.
Correct Answer

verified
Correct Answer
verified
Multiple Choice
If the MPC is 0.6, the multiplier will be
A) 4.0.
B) 6.0.
C) 2.5.
D) 1.67.
Correct Answer

verified
Correct Answer
verified
Multiple Choice
If disposable income is $900 billion when the average propensity to consume is 0.9, it can be concluded that
A) the marginal propensity to consume is also 0.9.
B) the marginal propensity to save is 0.1.
C) consumption is $900 billion.
D) saving is $90 billion.
Correct Answer

verified
Correct Answer
verified
Multiple Choice
Refer to the given data. At the $200 level of disposable income,
A) the marginal propensity to save is 2½ percent.
B) dissaving is $5.
C) the average propensity to save is 0.20.
D) the average propensity to consume is 0.80.
Correct Answer

verified
Correct Answer
verified
Multiple Choice
(Advanced analysis) Which of the following equations correctly represents the given data?
A) Yd = 40 + 0.6C.
B) C = 60 + 0.4Yd.
C) C = 40 + 0.6Yd.
D) C = 0.6Yd.
Correct Answer

verified
Correct Answer
verified
Multiple Choice
One can determine the amount of any level of total income that is consumed by
A) multiplying total income by the slope of the consumption schedule.
B) multiplying total income by the APC.
C) subtracting the MPS from total income.
D) multiplying total income by the MPC.
Correct Answer

verified
Correct Answer
verified
Multiple Choice
If the nominal interest rate is 18 percent and the real interest rate is 6 percent, the inflation rate is
A) 18 percent.
B) 24 percent.
C) 12 percent.
D) 6 percent.
Correct Answer

verified
Correct Answer
verified
Multiple Choice
Which of the following is correct?
A) MPC + MPS = APC + APS.
B) APC + MPS = APS + MPC.
C) APC + MPC = APS + MPS.
D) APC −APS = MPC − MPS.
Correct Answer

verified
Correct Answer
verified
True/False
1 + MPS = MPC.
Correct Answer

verified
Correct Answer
verified
Multiple Choice
Refer to the given table, which illustrates the multiplier process. The change in income in round two will be
A) $4.
B) $16.
C) $20.
D) $24.
Correct Answer

verified
Correct Answer
verified
Multiple Choice
The multiplier effect indicates that
A) a decline in the interest rate will cause a proportionately larger increase in investment.
B) a change in spending will change aggregate income by a larger amount.
C) a change in spending will increase aggregate income by the same amount.
D) an increase in total income will generate a larger change in aggregate expenditures.
Correct Answer

verified
Correct Answer
verified
Multiple Choice
Assume there are no prospective investment projects (I) that will yield an expected rate of return (r) of 25 percent or more, but there are $5 billion of investment opportunities with an expected rate of Return between 20 and 25 percent, an additional $5 billion between 15 and 20 percent, and so on. If The real interest rate is 15 percent in this economy, the aggregate amount of investment will be
A) $25 billion.
B) $20 billion.
C) $15 billion.
D) $10 billion.
Correct Answer

verified
Correct Answer
verified
Multiple Choice
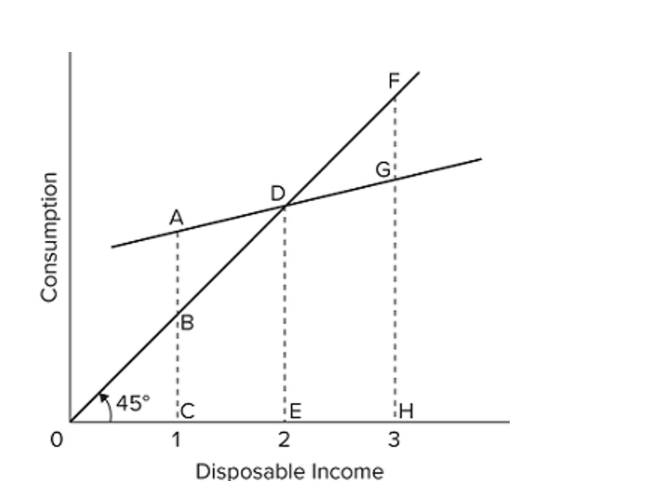 Refer to the consumption schedule shown in the graph. Disposable income equals consumption at point
A) A.
B) C.
C) D.
D) G.
Correct Answer

verified
Correct Answer
verified
Multiple Choice
Which of the following relations is not correct?
A) 1 − MPC = MPS.
B) APS + APC = 1.
C) MPS = MPC + 1.
D) MPC + MPS = 1.
Correct Answer

verified
Correct Answer
verified
Multiple Choice
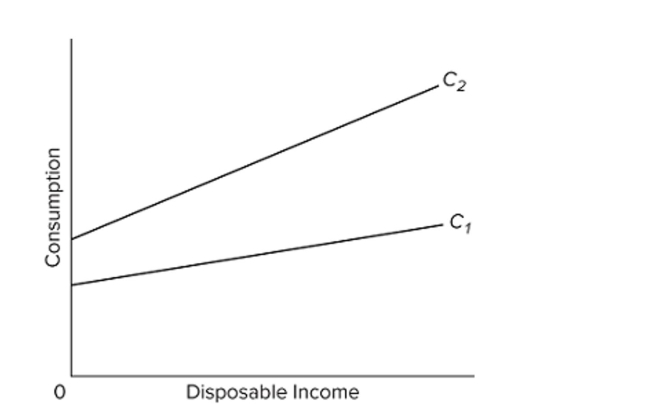 Suppose an economy's consumption schedule shifts from C1 to C2, as shown in the diagram. We can say that its
A) MPC has increased, but its APC at each income level is unchanged.
B) APC at each income level is increased, but its MPC is unchanged.
C) MPC and APC at each income level have both increased.
D) MPC and APC at each income level have both decreased.
Correct Answer

verified
Correct Answer
verified
Multiple Choice
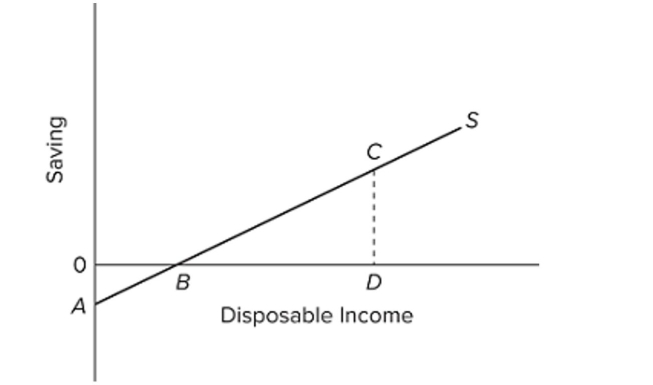 The saving schedule shown in the diagram would shift downward if, all else equal,
A) the average propensity to save increased at each income level.
B) the marginal propensity to save rose at each income level.
C) consumer wealth rose rapidly because of a significant increase in stock market prices.
D) the real interest rate rose.
Correct Answer

verified
Correct Answer
verified
Multiple Choice
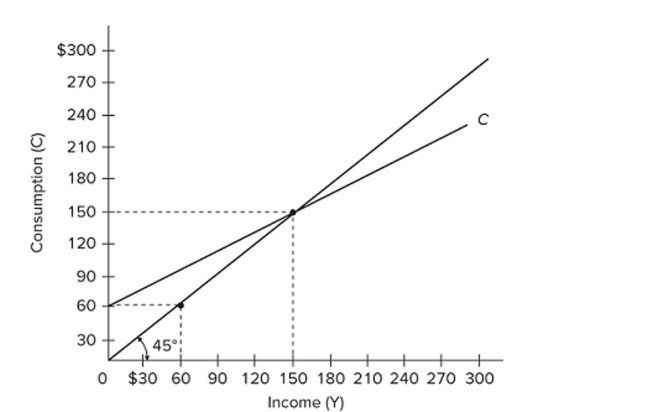 Refer to the diagram. The break-even level of income is
A) zero.
B) $150.
C) $60.
D) $120.
Correct Answer

verified
Correct Answer
verified
Multiple Choice
If a $200 billion increase in investment spending creates $200 billion of new income in the first round of the multiplier process and $160 billion in the second round, the multiplier in the economy is
A) 4.
B) 5.
C) 3.33.
D) 2.5.
Correct Answer

verified
Correct Answer
verified
Multiple Choice
The disposable income (DI) and consumption (C) schedules are for a private, closed economy. All ?gures are in billions of dollars. If plotted on a graph, the slope of the consumption schedule would be
A) 0.6.
B) 0.7.
C) 0.8.
D) 0.9.
Correct Answer

verified
Correct Answer
verified
Showing 101 - 120 of 233
Related Exams