A) $2.50.
B) $4.
C) $5.
D) $9.
Correct Answer

verified
Correct Answer
verified
Multiple Choice
Assume that for good X the supply curve for a good is a typical,upward-sloping straight line,and the demand curve is a typical downward-sloping straight line.If the good is taxed,and the tax is doubled,the
A) base of the triangle that represents the deadweight loss quadruples.
B) height of the triangle that represents the deadweight loss doubles.
C) deadweight loss of the tax doubles.
D) All of the above are correct.
Correct Answer

verified
Correct Answer
verified
Multiple Choice
As the tax on a good increases from $1 per unit to $2 per unit to $3 per unit and so on,the
A) tax revenue increases at first, but it eventually peaks and then decreases.
B) deadweight loss increases at first, but it eventually peaks and then decreases.
C) tax revenue always increases, and the deadweight loss always increases.
D) tax revenue always decreases, and the deadweight loss always increases.
Correct Answer

verified
Correct Answer
verified
Multiple Choice
The Laffer curve illustrates that
A) deadweight loss rises by the square of the increase in a tax.
B) deadweight loss rises exponentially as a tax increases.
C) tax revenue first rises, then falls as a tax increases.
D) Both a) and b) are correct.
Correct Answer

verified
Correct Answer
verified
Multiple Choice
In the market for widgets,the supply curve is the typical upward-sloping straight line,and the demand curve is the typical downward-sloping straight line.The equilibrium quantity in the market for widgets is 250 per month when there is no tax.Then a tax of $6 per widget is imposed.As a result,the government is able to raise $750 per month in tax revenue.We can conclude that the after-tax quantity of widgets is
A) 75 per month.
B) 100 per month.
C) 125 per month.
D) 150 per month.
Correct Answer

verified
Correct Answer
verified
Multiple Choice
When a tax is levied on a good,
A) neither buyers nor sellers are made worse off.
B) only sellers are made worse off.
C) only buyers are made worse off.
D) both buyers and sellers are made worse off.
Correct Answer

verified
Correct Answer
verified
Multiple Choice
Figure 8-12
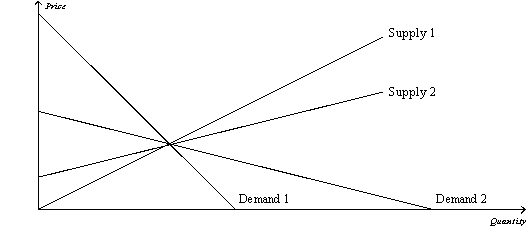 -Refer to Figure 8-12.Which of the following combinations will maximize the deadweight loss from a tax?
A) supply 1 and demand 1
B) supply 2 and demand 2
C) supply 1 and demand 2
D) supply 2 and demand 1
Correct Answer

verified
Correct Answer
verified
Multiple Choice
In a recent research paper published by the European Central Bank,two economists concluded that U.S.tax revenues would
A) increase if labor taxes were increased or if capital income taxes were increased.
B) increase if labor taxes were increased, but tax revenues would decrease if capital income taxes were increased.
C) decrease if labor taxes were increased, but tax revenues would increase if capital income taxes were increased.
D) decrease if labor taxes were increased or if capital income taxes were increased.
Correct Answer

verified
Correct Answer
verified
Multiple Choice
Figure 8-6
The vertical distance between points A and B represents a tax in the market.
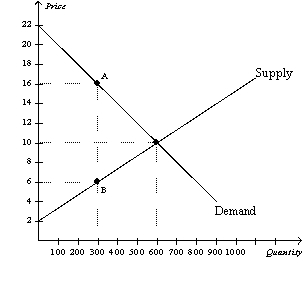 -Refer to Figure 8-6.Without a tax,the equilibrium price and quantity are
A) $16 and 300.
B) $10 and 600.
C) $10 and 300.
D) $6 and 300.
Correct Answer

verified
Correct Answer
verified
Multiple Choice
Figure 8-2
The vertical distance between points A and B represents a tax in the market.
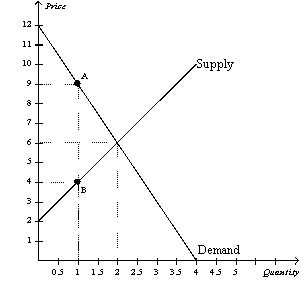 -Refer to Figure 8-2.The loss of consumer surplus for those buyers of the good who continue to buy it after the tax is imposed is
A) $0.
B) $1.50.
C) $3.
D) $4.50.
Correct Answer

verified
Correct Answer
verified
Multiple Choice
Figure 8-12
 -Refer to Figure 8-12.Which of the following statements is correct?
A) Supply 1 is more elastic than supply 2.
B) Demand 2 is more elastic than demand 1.
C) Demand 1 is more elastic than supply 1.
D) All of the above are correct.
Correct Answer

verified
Correct Answer
verified
Multiple Choice
Figure 8-1
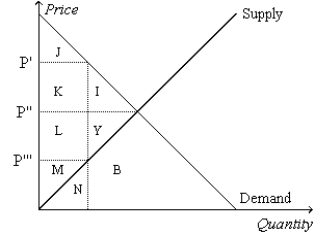 -Refer to Figure 8-1.Suppose the government imposes a tax of P' - P'''.Total surplus after the tax is measured by the area
A) I+Y.
B) J+K+L+M.
C) I+Y+B.
D) I+J+K+L+M+Y.
Correct Answer

verified
Correct Answer
verified
Multiple Choice
Assume that for good X the supply curve for a good is a typical,upward-sloping straight line,and the demand curve is a typical downward-sloping straight line.If the good is taxed,and the tax is doubled,the
A) base of the triangle that represents the deadweight loss doubles.
B) height of the triangle that represents the deadweight loss doubles.
C) deadweight loss of the tax quadruples.
D) All of the above are correct.
Correct Answer

verified
Correct Answer
verified
Multiple Choice
Figure 8-3
The vertical distance between points A and C represents a tax in the market.
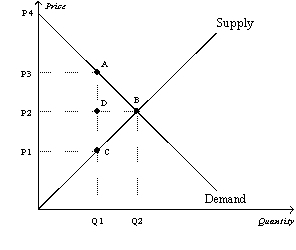 -Refer to Figure 8-3.The amount of deadweight loss associated with the tax is equal to
A) P3ACP1.
B) ABC.
C) P2ADP3.
D) P1DCP2.
Correct Answer

verified
Correct Answer
verified
True/False
Total surplus is always equal to the sum of consumer surplus and producer surplus.
Correct Answer

verified
Correct Answer
verified
True/False
If the size of a tax doubles,the deadweight loss doubles.
Correct Answer

verified
Correct Answer
verified
Multiple Choice
Which of the following statements correctly describes the relationship between the size of the deadweight loss and the amount of tax revenue as the size of a tax increases from a small tax to a medium tax and finally to a large tax?
A) Both the size of the deadweight loss and tax revenue increase.
B) The size of the deadweight loss increases, but the tax revenue decreases.
C) The size of the deadweight loss increases, but the tax revenue first increases, then decreases.
D) Both the size of the deadweight loss and tax revenue decrease.
Correct Answer

verified
Correct Answer
verified
Multiple Choice
Figure 8-6
The vertical distance between points A and B represents a tax in the market.
 -Refer to Figure 8-6.Without a tax,consumer surplus in this market is
A) $1,500.
B) $2,400.
C) $3,000.
D) $3,600.
Correct Answer

verified
Correct Answer
verified
Multiple Choice
Supply-side economics is a term associated with the views of
A) Ronald Reagan and Arthur Laffer.
B) Karl Marx.
C) Bill Clinton and Greg Mankiw.
D) Milton Friedman.
Correct Answer

verified
Correct Answer
verified
True/False
Economists disagree on whether labor taxes have a small or large deadweight loss.
Correct Answer

verified
Correct Answer
verified
Showing 141 - 160 of 424
Related Exams