A) $360 billion.
B) $400 billion.
C) $440 billion.
D) $480 billion.
E) $520 billion.
Correct Answer

verified
Correct Answer
verified
Multiple Choice
Use the table below to answer the following questions.
Table 26.3.1
 -Refer to Table 26.3.1.Consider the economy represented in the table.The economy is in
A) a long-run equilibrium, and resource prices will not change.
B) an above full-employment equilibrium, and factor prices will increase.
C) an above full-employment equilibrium, and factor prices will decrease.
D) a below full-employment equilibrium, and factor prices will decrease.
E) a below full-employment equilibrium, and factor prices will increase.
Correct Answer

verified
Correct Answer
verified
Multiple Choice
Which of the following situations illustrates how monetary policy can influence aggregate demand?
A) The Bank of Canada raises interest rates so people plan to buy less consumer durables. As a result, the aggregate demand curve shifts leftward.
B) Investors, anticipating an erosion of financial wealth due to inflation, decide to save more. As a result, aggregate demand decreases.
C) The government reduces the goods and services tax. As a result, consumption expenditure increases and aggregate demand increases.
D) The exchange rate value of the Canadian dollar rises. As a result, people living near the U.S.-Canada border increase their imports of goods and net exports decrease.
E) Both A and D are examples of monetary policy.
Correct Answer

verified
Correct Answer
verified
Multiple Choice
Use the figure below to answer the following questions.
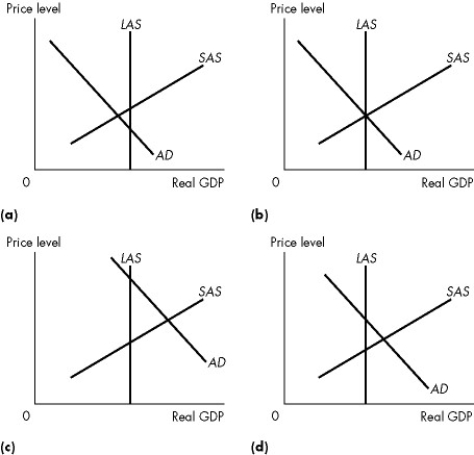 Figure 26.3.3
-Refer to Figure 26.3.3(b) .You might expect the government to
A) do nothing except maintain the current equilibrium.
B) cut government expenditure.
C) increase government expenditure.
D) pursue trade policies that reduce exports.
E) raise taxes.
Correct Answer

verified
Correct Answer
verified
Multiple Choice
We observe an increase in the price level and a decrease in real GDP.Which of the following is a possible explanation?
A) an increase in expected future profits
B) an increase in expected future income
C) an increase in factor prices
D) an increase in the quantity of capital
E) an increase in the quantity of money
Correct Answer

verified
Correct Answer
verified
Multiple Choice
Which one of the following newspaper quotations describes a leftward shift of the LAS curve?
A) "The decrease in consumer spending may lead to a recession."
B) "The increase in consumer spending is expected to lead to inflation, without any increase in real GDP."
C) "Recent higher wage settlements are expected to cause higher inflation this year."
D) "Growth has been unusually high the last few years due to more women entering the work force."
E) "The recent tornadoes destroyed many factories in Calgary and Edmonton."
Correct Answer

verified
Correct Answer
verified
Multiple Choice
Everything else remaining the same,an increase in foreign income
A) increases Canada's aggregate supply.
B) increases Canada's aggregate demand.
C) decreases Canada's aggregate demand.
D) creates a movement downward along Canada's aggregate demand curve.
E) decreases Canada's aggregate supply.
Correct Answer

verified
Correct Answer
verified
Multiple Choice
Classical macroeconomists recommend
A) policies that actively offset changes in long-run aggregate supply that result in negative economic growth.
B) an increase in the quantity of money to offset decreases in aggregate demand and a decrease in the quantity of money to offset increases in aggregate demand.
C) policies that actively offset changes in aggregate demand that bring recession.
D) policies that minimize the disincentive effects of taxes on employment, investment, and technological change.
E) all of the above.
Correct Answer

verified
Correct Answer
verified
Multiple Choice
Use the figure below to answer the following questions.
 Figure 26.3.3
-Refer to Figure 26.3.3.In which of the graphs would we predict that eventually the price level will fall and real GDP will increase,all else remaining the same?
A) (a) only
B) (b) only
C) (c) only
D) (d) only
E) (c) and (d)
Correct Answer

verified
Correct Answer
verified
Multiple Choice
Use the table below to answer the following questions.
Table 26.3.1
 -Refer to Table 26.3.1.Consider the economy represented in the table.The economy eventually moves to its long-run equilibrium.In long-run equilibrium,the price level is ________ and real GDP is ________ billion.
A) 125; $550
B) 120; $600
C) 120; $500
D) 130; $600
E) 130; $500
Correct Answer

verified
Correct Answer
verified
Multiple Choice
Economic growth results when there are increases in
A) aggregate demand.
B) the real wage rate.
C) long-run aggregate supply.
D) the inflationary gap.
E) short-run aggregate supply resulting from falling money wage rates and falling factor prices.
Correct Answer

verified
Correct Answer
verified
Multiple Choice
Use the figure below to answer the following questions.
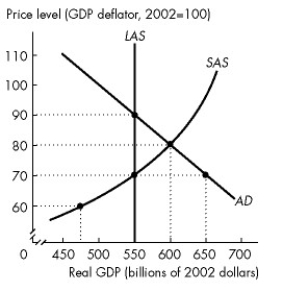 Figure 26.3.2
-Refer to Figure 26.3.2.In Mythlo there is a difference between the ________ equilibrium real GDP and potential GDP of ________ billion.
A) above full-employment; $50
B) above full-employment; $25
C) below full-employment; $50
D) below full-employment; $25
E) full employment; 0
Correct Answer

verified
Correct Answer
verified
Multiple Choice
A ________ macroeconomist believes that business cycle fluctuations are the efficient responses of a well-functioning market economy that is bombarded by shocks that arise from the uneven pace of technological change. A ________ macroeconomist believes that the short-run aggregate supply curve is horizontal at a fixed price level.
A) new classical; monetarist
B) classical; monetarist
C) Keynesian; new Keynesian
D) new classical; new Keynesian
E) monetarist; new classical
Correct Answer

verified
Correct Answer
verified
Multiple Choice
Long-run aggregate supply will increase for all of the following reasons except
A) a fall in the money wage rate.
B) an increase in human capital.
C) the introduction of new technology.
D) an increase in the full-employment quantity of labour.
E) an increase in the quantity of capital.
Correct Answer

verified
Correct Answer
verified
Multiple Choice
Keynesian macroeconomists recommend
A) an increase in the quantity of money to offset decreases in aggregate demand and a decrease in the quantity of money to offset increases in aggregate demand.
B) policies that actively offset changes in long-run aggregate supply that result in negative economic growth.
C) policies that minimize the disincentive effects of taxes on employment, investment, and technological change.
D) policies that actively offset changes in aggregate demand that bring recession.
E) none of the above.
Correct Answer

verified
Correct Answer
verified
Multiple Choice
Use the figure below to answer the following questions.
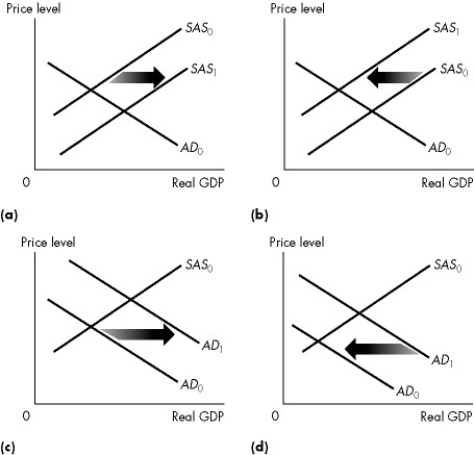 Figure 26.2.1
-Refer to Figure 26.2.1.Which graph illustrates what happens when the quantity of money decreases?
A) (a)
B) (b)
C) (c)
D) (d)
E) None of the above
Correct Answer

verified
Correct Answer
verified
Multiple Choice
Use the figure below to answer the following question.
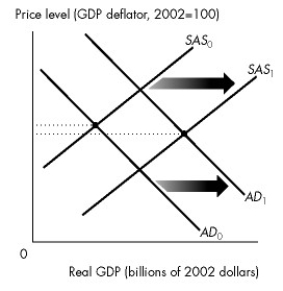 Figure 26.3.4
-Which of the following will lower the price level for sure?
A) The AD curve shifts rightward and the SAS curve shifts leftward.
B) The AD curve shifts rightward and the SAS curve remains unchanged.
C) The SAS curve shifts leftward.
D) The LAS curve shifts leftward.
E) None of the above.
Correct Answer

verified
Correct Answer
verified
Multiple Choice
Use the table below to answer the following questions.
Table 26.3.1
 -Refer to Table 26.3.1.Consider the economy represented in the table.In short-run macroeconomic equilibrium,the price level is ________ and the level of real GDP is ________ billion.
A) 120; $600
B) 120; $500
C) 125; $550
D) 130; $600
E) 130; $500
Correct Answer

verified
Correct Answer
verified
Multiple Choice
Use the figure below to answer the following questions.
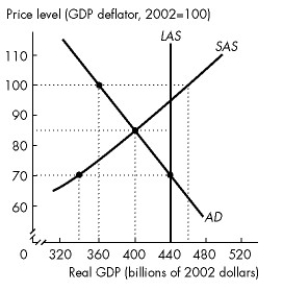 Figure 26.3.1
-Refer to Figure 26.3.1.Consider statements (1) and (2) and select the correct answer. (1) The economy of Econoworld is experiencing an above full-employment equilibrium.
(2) SAS will automatically shift rightward as the economy adjusts to long-run equilibrium.
A) (1) is true; (2) is false.
B) (2) is true; (1) is false.
C) (1) and (2) are false.
D) (1) and (2) are true.
E) (1) is true; (2) is true if unemployment is below the natural rate.
Correct Answer

verified
Correct Answer
verified
Multiple Choice
If factor prices remain constant ,an increase in aggregate demand
A) increases the price level and increases real GDP.
B) increases the price level and decreases real GDP.
C) decreases the price level and increases real GDP.
D) decreases the price level and decreases real GDP.
E) increases the price level, and leaves real GDP unchanged.
Correct Answer

verified
Correct Answer
verified
Showing 101 - 120 of 124
Related Exams