A) an increase in the price of a pizza.
B) an increase in income if pizza is a normal good.
C) a decrease in the cost of the tomato sauce used to produce pizza.
D) an increase in the price of a good that is a substitute for consumers.
E) a decrease in the number of pizza producers.
Correct Answer

verified
Correct Answer
verified
Multiple Choice
Which of the following shifts the supply curve of popcorn leftward?
A) A decrease in the cost of producing popcorn.
B) A decrease in the price of popcorn.
C) An increase in the price of popcorn.
D) A decrease in the number of popcorn suppliers.
E) A technological development in the production of popcorn.
Correct Answer

verified
Correct Answer
verified
Multiple Choice
If the price is below the equilibrium price,
A) the supply curve will shift rightward.
B) there is a shortage.
C) the demand curve will shift leftward.
D) there is a surplus.
E) the supply curve will shift leftward.
Correct Answer

verified
Correct Answer
verified
Multiple Choice
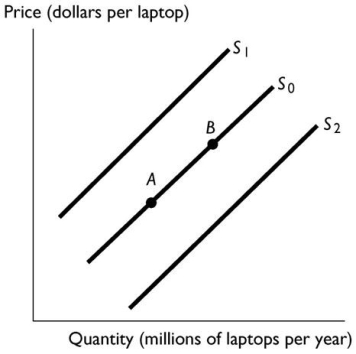 -The above figure shows the market for laptops.Which of the following shifts the supply curve from S₀to S₂?
A) An increase in the productivity of the workers manufacturing laptops.
B) A decrease in the price of laptops.
C) A decrease in the number of laptop manufactures and sellers.
D) An increase in the cost of hard drives.
E) An increase in the price of laptops.
Correct Answer

verified
Correct Answer
verified
Multiple Choice
Computer chips are a normal good.Suppose the economy slips into a recession so that income falls.As a result,the demand for computer chips ________ so that the price of a computer chip ________.
A) decreases;does not change
B) increases;rises
C) decreases;rises
D) increases;falls
E) decreases;falls
Correct Answer

verified
Correct Answer
verified
Multiple Choice
When there is a surplus of snowboards,the
A) supply of snowboards is greater than the demand for snowboards.
B) quantity of snowboards demanded is greater than the quantity of snowboards supplied.
C) price rises to restore the equilibrium.
D) demand for snowboards is greater than the supply of snowboards.
E) quantity of snowboards supplied is greater than the quantity of snowboards demanded.
Correct Answer

verified
Correct Answer
verified
Multiple Choice
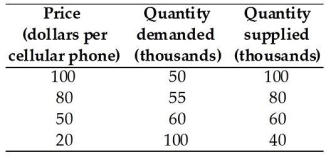 -Using the data in the table above,the equilibrium quantity and equilibrium price for a cellular phone are
A) 50,000 and $100.
B) 80,000 and $80.
C) 100,000 and $20.
D) 40,000 and $20.
E) 60,000 and $50.
Correct Answer

verified
Correct Answer
verified
Multiple Choice
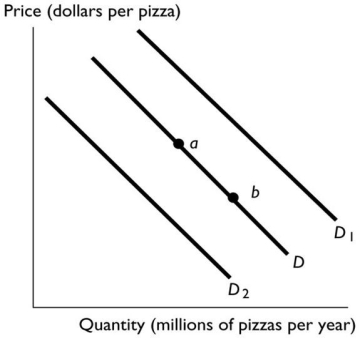 -In the above figure,the movement from point a to point b reflects
A) an increase in the price of the tomato sauce used to produce pizza.
B) an increase in the demand for pizza.
C) a decrease in the number of firms producing pizza.
D) an increase in the number of people who eat pizza.
E) a decrease in the price of pizza.
Correct Answer

verified
Correct Answer
verified
Multiple Choice
If the Health Services Union successfully negotiates a wage increase for its members,how does the wage increase affect the supply of health services?
A) The quantity supplied increases.
B) The supply decreases.
C) The supply increases.
D) The quantity supplied decreases.
E) Both answers B and D are correct.
Correct Answer

verified
Correct Answer
verified
Multiple Choice
Suppose a medical study reveals new benefits to consuming beef and at the same time a bumper corn crop reduces the cost of feeding steers.The equilibrium quantity of beef will
A) perhaps increase,decrease or stay the same,but more information is needed to determine which it does.
B) increase.
C) definitely either stay the same or decrease.
D) decrease.
E) stay the same.
Correct Answer

verified
Correct Answer
verified
Multiple Choice
The law of supply states that,other things remaining the same,
A) if the price of a good increases,firms buy less of it.
B) if the price of a good increases,the quantity supplied increases.
C) as people's income increases,the supply of goods increases.
D) demand increases when supply increases.
E) if the price of a good increases,the supply increases.
Correct Answer

verified
Correct Answer
verified
Multiple Choice
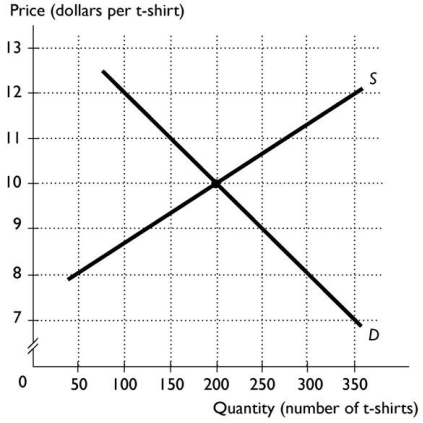 -The above figure shows the market for t-shirts.If the price of t-shirts is $12,then
A) there is a shortage and the price of t-shirts will rise.
B) there is a shortage and the price of t-shirts will fall.
C) the market is in equilibrium.
D) there is a surplus and the price of t-shirts will fall.
E) there is a surplus and the price of t-shirts will rise.
Correct Answer

verified
Correct Answer
verified
Multiple Choice
Suppose that the equilibrium price and quantity of new houses both increase.Which of the following could be a cause of this change?
A) The demand for new houses increased,and the supply did not change.
B) The supply of new houses increased,and the demand for new houses did not change.
C) Both the supply and demand for new houses decreased.
D) The supply of new houses decreased,and the demand for new houses did not change.
E) Both the supply and the demand for new houses increased,and the supply increased by more than the demand.
Correct Answer

verified
Correct Answer
verified
Multiple Choice
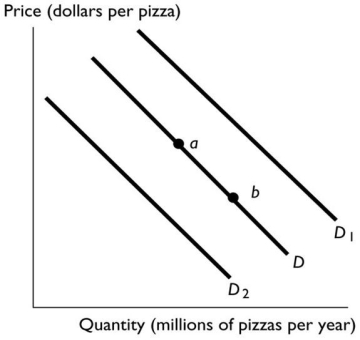 -In the above figure,the shift in the demand curve from D to D₁ can be the result of
A) an increase in the price of cola,a complement to pizza.
B) an increase in the number of teenagers,all of whom demand more pizza than other age groups.
C) a decrease in income if pizza is a normal good.
D) new technology that increases the profit from producing pizza.
E) a decrease in the price of a hamburger,a substitute for pizza.
Correct Answer

verified
Correct Answer
verified
Multiple Choice
When the demand curve shifts rightward and the market moves to a new equilibrium,then the
A) quantity supplied increases.
B) quantity supplied decreases.
C) supply increases.
D) supply decreases.
E) price falls to restore the equilibrium.
Correct Answer

verified
Correct Answer
verified
Multiple Choice
Assume a competitive market is in equilibrium.There is an increase in demand,but no change in supply.As a result,the equilibrium price ________,and the equilibrium quantity ________.
A) rises;does not change
B) rises;increases
C) falls;does not change
D) falls;increases
E) falls;decreases
Correct Answer

verified
Correct Answer
verified
Multiple Choice
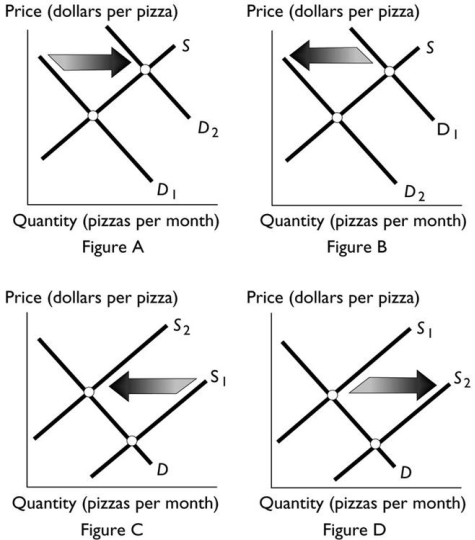 -Which figure above shows the effect of a technological advance in the production of pizza?
A) Figure A
B) Figure B
C) Figure C
D) Figure D
E) Both Figure A and Figure D
Correct Answer

verified
Correct Answer
verified
Multiple Choice
Suppose the current price of a kilogram of steak is $6 per kilogram and the equilibrium price is $9 per kilogram.What takes place?
A) There is a shortage,so the price rises and quantity demanded increases.
B) There is a surplus,so the price falls and quantity demanded increases.
C) There is a shortage,so the price falls and quantity demanded decreases.
D) There is a shortage,so the price rises and quantity demanded decreases.
E) There is a shortage,so the price falls and quantity demanded increases.
Correct Answer

verified
Correct Answer
verified
Multiple Choice
Advances in productivity increase supply because they might
A) increase the price expected in the future.
B) raise the prices of resources used to produce the good.
C) increase the number of firms producing the good.
D) decrease the cost of production.
E) decrease the number of goods available.
Correct Answer

verified
Correct Answer
verified
Multiple Choice
The "law of demand" refers to the fact that,other things remaining the same,when the price of a good rises,
A) the demand curve shifts rightward and there is a movement up along the demand curve to a smaller quantity demanded.
B) the demand curve shifts leftward.
C) there is a movement down along the demand curve to a larger quantity demanded.
D) the demand curve shifts rightward.
E) there is a movement up along the demand curve to a smaller quantity demanded.
Correct Answer

verified
Correct Answer
verified
Showing 81 - 100 of 144
Related Exams