Correct Answer

verified
Correct Answer
verified
Multiple Choice
If opportunity costs are ________, the production possibilities frontier would be graphed as a negatively sloped straight line.
A) decreasing
B) increasing
C) negative
D) constant
Correct Answer

verified
Correct Answer
verified
Multiple Choice
Which of the following statements is true about a simple circular flow model?
A) Producers are neither buyers nor sellers in the product market.
B) Households are neither buyers nor sellers in the input market.
C) Producers are buyers in the factor market.
D) Households are sellers in the product market.
Correct Answer

verified
Correct Answer
verified
Multiple Choice
Figure 2.13 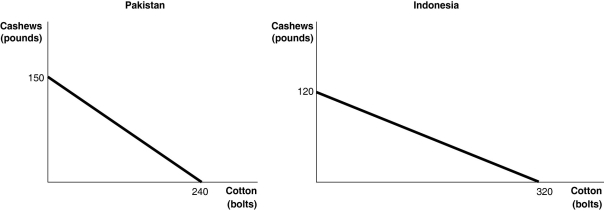 Figure 2.13 shows the production possibilities frontiers for Pakistan and Indonesia.Each country produces two goods, cotton and cashews.
Alt text for Figure 2.13: In figure 2.13, 2 graphs, show the production possibilities frontiers for Pakistan and Indonesia.
Long description for Figure 2.13: The graph on the left represents Pakistan.The x-axis is labelled, cotton in bolts, and the amount 240 marked.The y-axis is labelled, cashews in pounds, and the amount 150 is marked .A slanted line is drawn from point 150 on the y-axis to point 240 on the x-axis.The graph on the right represents Indonesia.The x-axis is labelled, cotton, in bolts, and the amount 320 is marked.The y-axis is labelled, cashews, in pounds, and the amount 120 marked.A slanted line is drawn from point 120 on the y-axis to point 320 on the x-axis.
-Refer to Figure 2.13.What is the opportunity cost of producing 1 bolt of cotton in Pakistan?
A) 3/8 of a pound of cashews
B) 5/8 of a pound of cashews
C) 1 3/5 pounds of cashews
D) 150 pounds of cashews
Correct Answer

verified
Correct Answer
verified
Multiple Choice
Figure 2.22 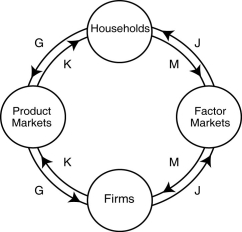 Alt text for Figure 2.22: In figure 2.22, a circular flow diagram.
Long description for Figure 2.22: 4 circles arranged in a circle, labelled as follows, clockwise from the top center: Households, Factor Markets, Firms, and Product Markets.All these circles are connected by arrows J, G K and M, as follows: Arrow M: Households to Factor Markets Arrow J: Factor Markets to Households Arrow M: Factor Markets to Firms Arrow J: Firms to Factor Markets Arrow K: Firms to Product Markets Arrow G: Product Markets to Firms Arrow K: Product Markets to Households Arrow G: Households to Product Markets
-Refer to Figure 2.22.Which two arrows in the diagram depict the following transaction? Lizzie Haxem hires College Pro Painters, a painting company, to paint her home.
A) J and M
B) K and G
C) K and M
D) J and G
Correct Answer

verified
Correct Answer
verified
Multiple Choice
Table 2.6  Table 2.6 shows the number of labour hours required to produce a digital camera and a pound of wheat in China and South Korea.
-Refer to Table 2.6.If the two countries specialize and trade, who should export wheat?
A) There is no basis for trade between the two countries.
B) China
C) South Korea
D) They should both be exporting wheat.
Correct Answer

verified
Correct Answer
verified
Multiple Choice
Households
A) purchase final goods and services in the factor market.
B) purchase final goods and services in the product market.
C) purchase resources in the product market.
D) purchase resources in the factor market.
Correct Answer

verified
Correct Answer
verified
Multiple Choice
Increasing marginal opportunity cost implies that
A) the more resources already devoted to any activity, the payoff from allocating yet more resources to that activity increases by progressively smaller amounts.
B) the more resources already devoted to any activity, the benefits from allocating yet more resources to that activity decreases by progressively larger amounts.
C) rising opportunity costs make it inefficient to produce beyond a certain quantity.
D) the law of scarcity applies.
Correct Answer

verified
Correct Answer
verified
True/False
It is possible to have a comparative advantage in producing a good or service without having an absolute advantage.
Correct Answer

verified
Correct Answer
verified
Multiple Choice
If the price of a good or service rises, households have to choose whether to buy less of that good or service or spend less on other goods and services.When doctors and/or nurses demand pay increases, provincial governments
A) cut back on their total spending on health care.
B) increase spending on other programs.
C) automatically increase sales taxes to pay for the increased spending on health care professionals.
D) must either cut back on other programs, hire fewer doctors and/or nurses, or increase taxation.
Correct Answer

verified
Correct Answer
verified
Multiple Choice
Figure 2.8 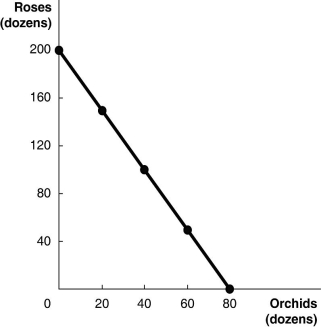 Figure 2.8 above shows the production possibilities frontier for Vidalia, a nation that produces two goods, roses and orchids.
Alt text for Figure 2.8: In figure 2.8, a graph illustrates the production possibilities frontier for roses and orchids in Vidalia.
Long description for Figure 2.8: The x-axis is labelled, orchids, in dozens, and is marked from 0 to 80 in increments of 20.The y-axis is labelled, roses, in dozens, and is marked from 0 to 200 in increments of 40.Five points (0, 200) , (20, 150) , (40, 100) , (60, 50) , and (80, 0) are plotted on the graph and joined to form a line, which slants from the top left corner and slopes down to the bottom right corner.
-Refer to Figure 2.8.Suppose Vidalia receives orders for 60 dozen orchids and 120 dozen roses. Vidalia will
A) not be able to produce enough to fill the order.
B) make a lot of extra money.
C) be using its resources inefficiently if it fills the order.
D) experience economic growth if it fills the order.
Correct Answer

verified
Correct Answer
verified
True/False
Entrepreneurs bring together the factors of production to produce goods and services.
Correct Answer

verified
Correct Answer
verified
Multiple Choice
Table 2.1
Production choices for Tomaso's Trattoria  -Refer to Table 2.1.Assume Tomaso's Trattoria only produces pizzas and calzones.A combination of 36 pizzas and 30 calzones would appear
A) along Tomaso's production possibilities frontier.
B) inside Tomaso's production possibilities frontier.
C) outside Tomaso's production possibilities frontier.
D) at the horizontal intercept of Tomaso's production possibilities frontier.
Correct Answer

verified
Correct Answer
verified
Multiple Choice
Figure 2.10 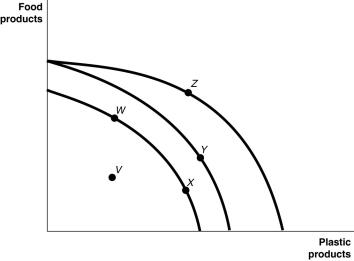 Figure 2.10 shows various points on three different production possibilities frontiers for a nation.
Alt text for Figure 2.10: In figure 2.10, a graph comparing 3 different production possibilities frontiers for a nation.
Long description for Figure 2.10: The x-axis is labelled, plastic products, and the y-axis is labelled, food products.3 convex curves are shown, with points V, W, X, Y, and Z plotted.The first curve begins just past the half-way point on the y-axis, and ends just past the half-way point on the x-axis.Points W and X are plotted along the curve, with point W approximately 1 third of the way from the start of the curve, and point X more than 2 thirds of the way along the curve.The second curve begins almost 3 quarters of the way up the y-axis and ends just past the termination of the first curve on the x-axis.Point Y is plotted on the second curve, approximately 2 thirds of the way along the curve.The third curve begins at the same point as the second curve, and ends approximately 3 quarters of the way along the x-axis.Point Z is plotted on the third curve, a little less than half-way along the curve.Point V is plotted between the first curve and the origin.
-Refer to Figure 2.10.A movement from ________ could occur because of an influx of immigrant labour.
A) X to W
B) X to Y
C) W to V
D) W to X
Correct Answer

verified
Correct Answer
verified
Multiple Choice
Table 2.11  Table 2.11 shows the output per day of two gardeners, George and Jack.They can either devote their time to mowing lawns or cultivating gardens.
-Refer to Table 2.11.Which of the following statements is true?
A) Jack has an absolute advantage in both tasks.
B) George has an absolute advantage in both tasks.
C) Jack has an absolute advantage in lawn mowing and George in garden cultivating.
D) Jack has an absolute advantage in garden cultivating and George in lawn mowing.
Correct Answer

verified
Correct Answer
verified
Multiple Choice
The opportunity cost of taking an online history class is
A) the knowledge and enjoyment you receive from taking the class.
B) the value of the time spent online.
C) equal to the highest value of an alternative use of the time and money spent on the class.
D) zero because there is no classroom time involved if you are enrolled in the course.
E) the cost of tuition and fees only.
Correct Answer

verified
Correct Answer
verified
Multiple Choice
Table 2.6  Table 2.6 shows the number of labour hours required to produce a digital camera and a pound of wheat in China and South Korea.
-Refer to Table 2.6.What is China's opportunity cost of producing one digital camera?
A) 0.04 pounds of wheat
B) 4 pounds of wheat
C) 25 pounds of wheat
D) 40 pounds of wheat
Correct Answer

verified
Correct Answer
verified
Multiple Choice
Figure 2.5 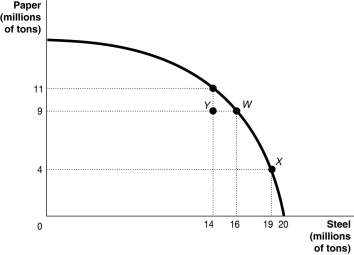 Alt text for Figure 2.5: In figure 2.5, a graph compares paper and steel production.
Long description for Figure 2.5: The x-axis is labelled, steel in millions of tons and the quantities 14, 16, 19, and 20 are marked.The y-axis is labelled, paper in millions of tons, and the quantities 4, 9, and 11 are marked.Points Y(14, 9) , W(16, 9) , (19, 4) , and an unnamed point (14, 11) are plotted on the graph, and joined to the respective axes using dotted lines.A concave curve is drawn from the y-axis to the x-axis, passing through the unnamed point (14, 11) , and points W(16, 9) , and X(19, 4) .Point Y is between the curve and the axes.
-Refer to Figure 2.5. If this economy is currently considering switching from point X to point W, what is the opportunity cost of each newly produced ton of paper?
A) 0.6 tons of steel
B) 3 tons of steel
C) 1.67 tons of paper
D) 5 tons of paper.
Correct Answer

verified
Correct Answer
verified
Multiple Choice
The slope of a production possibilities frontier
A) has no economic relevance or meaning.
B) is always constant.
C) is always varying.
D) measures the opportunity cost of producing one more unit of a good.
Correct Answer

verified
Correct Answer
verified
Multiple Choice
An example of a factor of production is
A) stock issued by Bombardier.
B) the train cars exported by Bombardier.
C) a snow machine produced by Bombardier.
D) a worker hired by Bombardier.
Correct Answer

verified
Correct Answer
verified
Showing 281 - 300 of 314
Related Exams