A) demand for good X will decrease.
B) quantity demanded of good X will decrease.
C) demand for good X will increase.
D) quantity demanded of good X will increase.
Correct Answer

verified
Correct Answer
verified
Multiple Choice
Figure 4-12
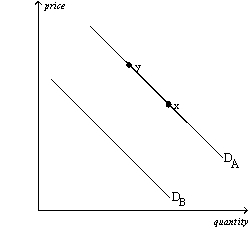
The diagram below pertains to the demand for turkey in the United States.  -Refer to Figure 4-12.All else equal,a sale on chicken would cause a move
A) from DA to DB.
B) from DB to DA.
C) from x to y.
D) from y to x.
Correct Answer

verified
Correct Answer
verified
True/False
The demand curve is the upward-sloping line relating price and quantity demanded.
Correct Answer

verified
Correct Answer
verified
Multiple Choice
Suppose scientists provide evidence that chocolate pudding increases the bad cholesterol levels of those who eat it.We would expect to see
A) no change in the demand for chocolate pudding.
B) a decrease in the demand for chocolate pudding.
C) an increase in the demand for chocolate pudding.
D) a decrease in the supply of chocolate pudding.
Correct Answer

verified
Correct Answer
verified
Multiple Choice
You love peanut butter.You hear on the news that 50 percent of the peanut crop in the South has been wiped out by drought,and that this will cause the price of peanuts to double by the end of the year.As a result,
A) your demand for peanut butter will increase,but not until the end of the year.
B) your demand for peanut butter increases today.
C) your demand for peanut butter decreases as you look for a substitute good.
D) your demand for peanut butter shifts left today.
Correct Answer

verified
Correct Answer
verified
Multiple Choice
A decrease in the price of a good would
A) increase the supply of the good.
B) increase the quantity demanded of the good.
C) give producers an incentive to produce more to keep profits from falling.
D) shift the supply curve for the good to the left.
Correct Answer

verified
Correct Answer
verified
True/False
An increase in supply will cause a decrease in price,which will cause an increase in demand.
Correct Answer

verified
Correct Answer
verified
Multiple Choice
Which of the following might cause the supply curve for an inferior good to shift to the right?
A) An increase in input prices.
B) A decrease in consumer income.
C) An improvement in production technology that makes production of the good more profitable.
D) A decrease in the number of sellers in the market.
Correct Answer

verified
Correct Answer
verified
Multiple Choice
Two goods are complements when a decrease in the price of one good
A) decreases the quantity demanded of the other good.
B) decreases the demand for the other good.
C) increases the quantity demanded of the other good.
D) increases the demand for the other good.
Correct Answer

verified
Correct Answer
verified
Multiple Choice
The demand curve for a good is
A) a line that relates price and quantity demanded.
B) a line that relates income and quantity demanded.
C) a line that relates quantity demanded and quantity supplied.
D) a line that relates price and income.
Correct Answer

verified
Correct Answer
verified
Multiple Choice
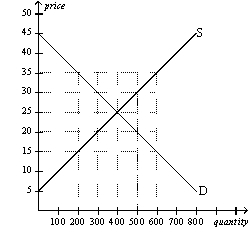
Figure 4-8  -Refer to Figure 4-8.At what price would there be an excess demand of 200 units of the good?
A) $15
B) $20
C) $30
D) $35
Correct Answer

verified
Correct Answer
verified
True/False
A decrease in supply will cause an increase in price,which will cause a decrease in quantity demanded.
Correct Answer

verified
Correct Answer
verified
Multiple Choice
Economists normally
A) do not try to explain people's tastes,but they do try to explain what happens when tastes change.
B) believe that they must be able to explain people's tastes in order to explain what happens when tastes change.
C) do not believe that people's tastes determine demand and therefore they ignore the subject of tastes.
D) incorporate tastes into economic models only to the extent that tastes determine whether pairs of goods are substitutes or complements.
Correct Answer

verified
Correct Answer
verified
Multiple Choice
Once the demand curve for a product or service is drawn,it
A) remains stable over time.
B) can shift either rightward or leftward.
C) is possible to move along the curve,but the curve will not shift.
D) tends to become steeper over time.
Correct Answer

verified
Correct Answer
verified
Multiple Choice
Table 4-7
The demand schedule below pertains to sandwiches demanded per week.
 -Refer to Table 4-7.Suppose Charlie,Maxine,and Quinn are the only demanders of sandwiches.Also suppose the following:
• x = 2
• the current price of a sandwich is $3.00
• the market quantity supplied of sandwiches is 5
• the slope of the supply curve is 1
Then
A) there is currently a shortage of 5 sandwiches and the equilibrium price of a sandwich is between $3.00 and $5.00.
B) there is currently a shortage of 5 sandwiches and the equilibrium price of a sandwich is $5.00.
C) there is currently a surplus of 5 sandwiches and the equilibrium price of a sandwich is between $3.00 and $5.00.
D) there is currently a surplus of 5 sandwiches and the equilibrium price of a sandwich is $5.00.
Correct Answer

verified
Correct Answer
verified
Multiple Choice
Table 4-8
 -Refer to Table 4-8.Which space represents a decrease in equilibrium price and an indeterminate change in equilibrium quantity?
A) A
B) B
C) C
D) D
Correct Answer

verified
Correct Answer
verified
Multiple Choice
Table 4-3
 -Refer to Table 4-3.If these are the only four sellers in the market,then when the price increases from $6 to $8,the market quantity supplied
A) increases by 0.5 unit.
B) increases by 2 units.
C) decreases by 4 units.
D) increases by 42 units.
Correct Answer

verified
Correct Answer
verified
Multiple Choice
Table 4-5
 -Refer to Table 4-5.The equilibrium price and quantity,respectively,are
A) $2 and 50.
B) $6 and 30.
C) $6 and 60.
D) $12 and 30.
Correct Answer

verified
Correct Answer
verified
Multiple Choice
Which of these statements best represents the law of supply?
A) When input prices increase,sellers produce less of the good.
B) When production technology improves,sellers produce less of the good.
C) When the price of a good decreases,sellers produce less of the good.
D) When sellers' supplies of a good increase,the price of the good increases.
Correct Answer

verified
Correct Answer
verified
Multiple Choice
Each of the following is a determinant of demand except
A) tastes.
B) technology.
C) expectations.
D) the prices of related goods.
Correct Answer

verified
Correct Answer
verified
Showing 141 - 160 of 467
Related Exams