A) microeconomists because they consider how to balance equality and efficiency.
B) microeconomists because they consider how best to design a tax system.
C) macroeconomists because they consider how policymakers can use the tax system to stabilize economic activity.
D) All of the above are correct.
Correct Answer

verified
Correct Answer
verified
Multiple Choice
If the tax on a good is increased from $0.10 per unit to $0.40 per unit,the deadweight loss from the tax
A) remains constant.
B) increases by a factor of 4.
C) increases by a factor of 9.
D) increases by a factor of 16.
Correct Answer

verified
Correct Answer
verified
Multiple Choice
Figure 8-5
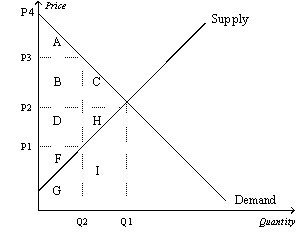
Suppose that the government imposes a tax of P3 - P1.  -Refer to Figure 8-5.The tax causes a reduction in consumer surplus that is represented by area
A) A.
B) B+C.
C) C+H.
D) F.
Correct Answer

verified
Correct Answer
verified
Multiple Choice
The benefit to buyers of participating in a market is measured by
A) consumer surplus.
B) producer surplus.
C) total surplus.
D) deadweight loss.
Correct Answer

verified
Correct Answer
verified
Multiple Choice
As the tax on a good increases from $1 per unit to $2 per unit to $3 per unit and so on,the
A) tax revenue increases at first,but it eventually peaks and then decreases.
B) deadweight loss increases at first,but it eventually peaks and then decreases.
C) tax revenue always increases,and the deadweight loss always increases.
D) tax revenue always decreases,and the deadweight loss always increases.
Correct Answer

verified
Correct Answer
verified
Multiple Choice
When a tax is imposed on the buyers of a good,the demand curve shifts
A) downward by the amount of the tax.
B) upward by the amount of the tax.
C) downward by less than the amount of the tax.
D) upward by more than the amount of the tax.
Correct Answer

verified
Correct Answer
verified
Essay
Illustrate on three demand-and-supply graphs how the size of a tax (small,medium and large)can alter total revenue and deadweight loss.
Correct Answer

verified
Correct Answer
verified
Multiple Choice
The decrease in total surplus that results from a market distortion,such as a tax,is called a
A) wedge loss.
B) revenue loss.
C) deadweight loss.
D) consumer surplus loss.
Correct Answer

verified
Correct Answer
verified
Multiple Choice
Which of the following events is consistent with an increase in the deadweight loss of the gasoline tax from $30 million to $120 million?
A) The tax on gasoline increases from $0.30 per gallon to $0.45 per gallon.
B) The tax on gasoline increases from $0.30 per gallon to $0.60 per gallon.
C) The tax on gasoline increases from $0.25 per gallon to $0.45 per gallon.
D) The tax on gasoline increases from $0.25 per gallon to $1.00 per gallon.
Correct Answer

verified
Correct Answer
verified
Multiple Choice
To measure the gains and losses from a tax on a good,economists use the tools of
A) macroeconomics.
B) welfare economics.
C) international-trade theory.
D) circular-flow analysis.
Correct Answer

verified
Correct Answer
verified
Multiple Choice
Figure 8-4
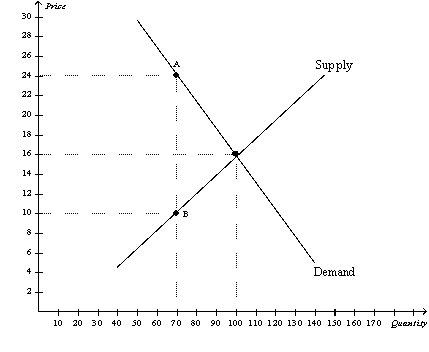
The vertical distance between points A and B represents a tax in the market.  -Refer to Figure 8-4.The per-unit burden of the tax on sellers is
A) $14.
B) $10.
C) $8.
D) $6.
Correct Answer

verified
Correct Answer
verified
Multiple Choice
Which of the following countries has the highest tax rate?
A) Italy
B) Canada
C) United States
D) Japan
Correct Answer

verified
Correct Answer
verified
True/False
When a tax is imposed,the loss of consumer surplus and producer surplus as a result of the tax exceeds the tax revenue collected by the government.
Correct Answer

verified
Correct Answer
verified
Multiple Choice
Scenario 8-2 Tom mows Stephanie's lawn for $25.Tom's opportunity cost of mowing Stephanie's lawn is $20,and Stephanie's willingness to pay Tom to mow her lawn is $28. -Refer to Scenario 8-2.If Stephanie hires Tom to mow her lawn,Stephanie's consumer surplus is
A) $3.
B) $5.
C) $8.
D) $25.
Correct Answer

verified
Correct Answer
verified
Multiple Choice
For good A,the supply curve is the typical upward-sloping straight line,and the demand curve is the typical downward-sloping straight line.When good A is taxed,the area on the relevant supply-and-demand graph that represents the deadweight loss is
A) larger than the area that represents consumer surplus in the absence of the tax.
B) larger than the area that represents government's tax revenue.
C) a triangle.
D) All of the above are correct.
Correct Answer

verified
Correct Answer
verified
Multiple Choice
Figure 8-5
Suppose that the government imposes a tax of P3 - P1.  -Refer to Figure 8-5.The benefit to the government is measured by
A) tax revenue and is represented by area A+B.
B) tax revenue and is represented by area B+D.
C) the net gain in total surplus and is represented by area B+D.
D) the net gain in total surplus and is represented by area C+H.
Correct Answer

verified
Correct Answer
verified
Multiple Choice
Figure 8-8
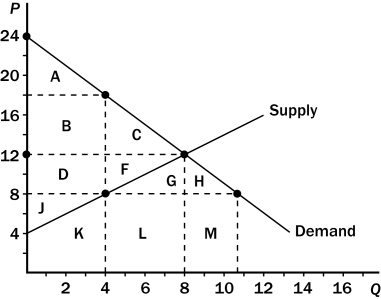
Suppose the government imposes a $10 per unit tax on a good.  -Refer to Figure 8-8.The tax causes producer surplus to decrease by the area
A) D+F.
B) D+F+G.
C) D+F+J.
D) D+F+G+H.
Correct Answer

verified
Correct Answer
verified
Multiple Choice
Suppose a tax of $0.50 per unit on a good creates a deadweight loss of $100.If the tax is increased to $2.50 per unit,the deadweight loss from the new tax would be
A) $200.
B) $250.
C) $500.
D) $2,500.
Correct Answer

verified
Correct Answer
verified
Multiple Choice
Figure 8-2
The vertical distance between points A and B represents a tax in the market.  -Refer to Figure 8-2.The loss of producer surplus associated with some sellers dropping out of the market as a result of the tax is
A) $0.
B) $1.
C) $2.
D) $3.
Correct Answer

verified
Correct Answer
verified
Multiple Choice
Figure 8-8
Suppose the government imposes a $10 per unit tax on a good.  -Refer to Figure 8-8.After the tax goes into effect,consumer surplus is the area
A) A.
B) B+C.
C) A+B+C.
D) A+B+D+J+K.
Correct Answer

verified
Correct Answer
verified
Showing 321 - 340 of 353
Related Exams