A) move its demand curve to the right.
B) move its demand curve to the left.
C) cause a movement along the demand curve to a (higher price, lower quantity) point.
D) cause a movement along the demand curve to a (lower price, higher quantity) point.
Correct Answer

verified
Correct Answer
verified
Multiple Choice
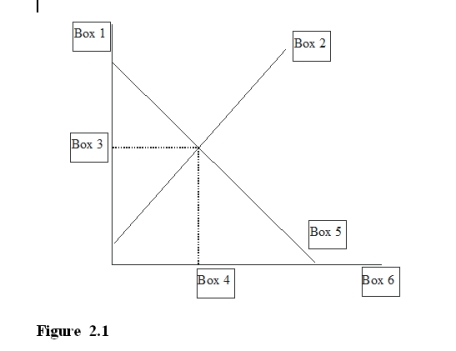
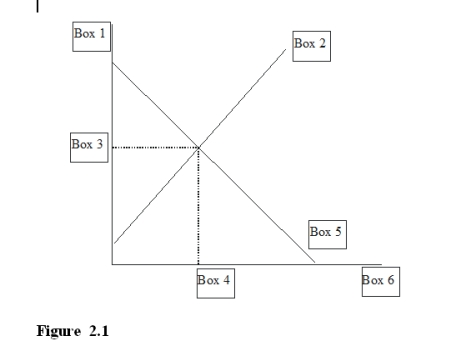
 -In Figure 2.1, Box 2 would be labeled
A) P* for equilibrium price.
B) P for price.
C) S for supply.
D) D for demand.
Correct Answer

verified
Correct Answer
verified
Multiple Choice
A shortage exists when
A) QD>QS
B) QD<QS
C) QD=QS
D) an act of god makes goods available at very low prices.
Correct Answer

verified
Correct Answer
verified
Multiple Choice
The notion that the money in your possession will buy less when the price rises is provided as the explanation for
A) the substitution effect.
B) the real-balances effect.
C) diminishing marginal utility.
Correct Answer

verified
Correct Answer
verified
Multiple Choice
The notion that when the price of the good you want rises you will buy less of it because you will find another good that will do instead, is provided as the explanation for
A) the substitution effect.
B) the real-balances effect.
C) diminishing marginal utility.
Correct Answer

verified
Correct Answer
verified
Multiple Choice
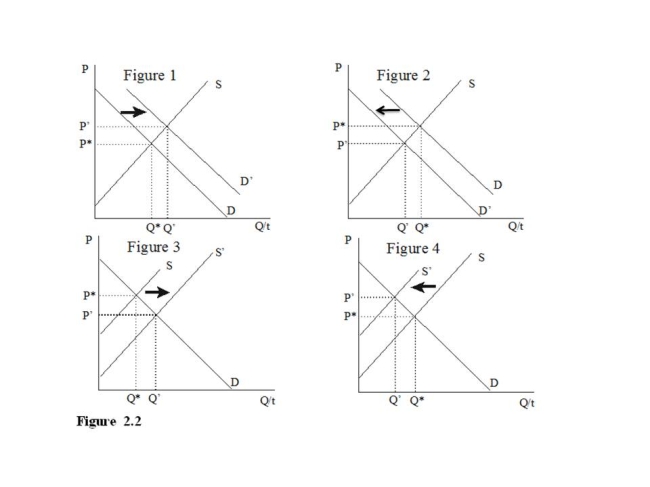
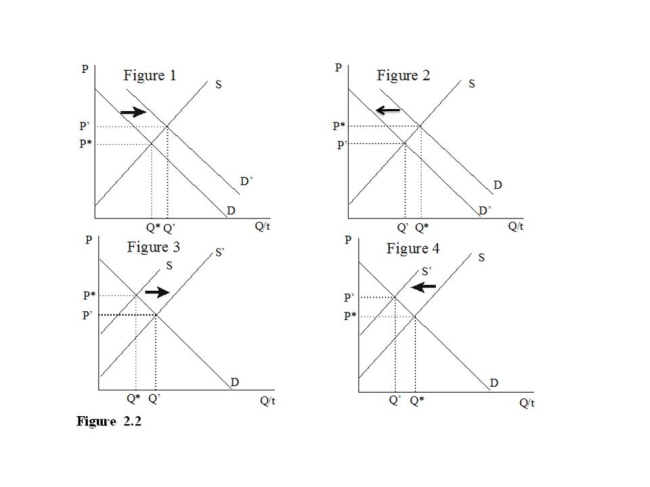
 -Of the collection of supply and demand diagrams in Figure 2.2, which one shows the result of a decrease in the price of a complement for a good?
A) Figure 1
B) Figure 2
C) Figure 3
D) Figure 4
Correct Answer

verified
Correct Answer
verified
Multiple Choice
 -In Figure 2.1, Box 6 would be labeled
A) P* for equilibrium price.
B) S for supply.
C) P for price.
D) Q/t for quantity per unit of time.
Correct Answer

verified
Correct Answer
verified
Multiple Choice
On the Heritage Foundation's scale of "Economic Freedom," which of the following countries is most "Free"?
A) Venezuela
B) Ireland
C) North Korea
D) Russia
Correct Answer

verified
Correct Answer
verified
Multiple Choice
If there is a good that is consumed almost entirely by the elderly, an aging of the overall population would
A) move its demand curve to the right.
B) move its demand curve to the left.
C) cause a movement along the demand curve to a (higher price, lower quantity) point.
D) cause a movement along the demand curve to a (lower price, higher quantity) point.
Correct Answer

verified
Correct Answer
verified
Multiple Choice
If the taste for a good increases, the
A) demand curve will shift to the right.
B) supply curve will shift to the right.
C) demand curve will shift to the left.
D) supply curve will shift to the left.
Correct Answer

verified
Correct Answer
verified
Multiple Choice
Which of the following is the best example of the concept of "substitute"?
A) SUV's
B) Coke and Pepsi
C) Ramen noodles
D) Hot dogs and hot dog buns
Correct Answer

verified
Correct Answer
verified
Multiple Choice
If there is an expectation that the price of a good will increase in the next month this would immediately
A) move its supply curve to the right.
B) move its supply curve to the left.
C) cause a movement along the supply curve to a (higher price, higher quantity) point.
D) cause a movement along the supply curve to a (lower price, lower quantity) point.
Correct Answer

verified
Correct Answer
verified
Multiple Choice
Unless circumstances are quite out of the ordinary, a supply curve will be
A) vertical.
B) horizontal.
C) downward sloping.
D) upward sloping.
Correct Answer

verified
Correct Answer
verified
Multiple Choice
The quintessential example for the price of an input and its impact on an output is
A) Hotdogs and hotdog buns
B) Crude oil and gasoline
C) Corn and soybeans
D) 7up and Sprite
Correct Answer

verified
Correct Answer
verified
Multiple Choice
If a good is normal and income increases then
A) the demand curve will shift to the right.
B) the demand curve will shift to the left.
C) the supply curve will shift to the right.
D) the supply curve will shift to the left.
Correct Answer

verified
Correct Answer
verified
Multiple Choice
The Law of Supply indicates that
A) there is a negative relationship between quantity demanded and quantity supplied.
B) there is a negative relationship between quantity supplied and price.
C) there is a positive relationship between quantity demanded and quantity supplied.
D) there is a positive relationship between quantity supplied and price.
Correct Answer

verified
Correct Answer
verified
Multiple Choice
The Law of Demand indicates that
A) there is a negative relationship between quantity demanded and quantity supplied.
B) there is a negative relationship between quantity demanded and price.
C) there is a positive relationship between quantity demanded and quantity supplied.
D) there is a positive relationship between quantity demanded and price.
Correct Answer

verified
Correct Answer
verified
Multiple Choice
 -Of the collection of supply and demand diagrams in Figure 2.2 which one(s) show the result of an decrease in the expected future price?
A) Figure 1
B) Figure 4
C) Figures 2 and 3
D) Figures 1 and 4
Correct Answer

verified
Correct Answer
verified
Multiple Choice
If a tax (paid by consumers) on a good is reduced this would
A) move its demand curve to the right.
B) move its demand curve to the left.
C) cause a movement along the demand curve to a (higher price, lower quantity) point.
D) cause a movement along the demand curve to a (lower price, higher quantity) point.
Correct Answer

verified
Correct Answer
verified
Multiple Choice
The quantity demanded is the amount households wish to purchase
A) at all possible prices during a specified period of time.
B) at a particular price during a specified period of time.
C) at a particular price (the timeframe is irrelevant) .
D) at all possible prices (the timeframe is irrelevant) .
Correct Answer

verified
Correct Answer
verified
Showing 121 - 140 of 204
Related Exams