A) a downward-sloping straight line.
B) an upward-sloping straight line.
C) a downward-sloping convex curve.
D) a downward-sloping concave curve.
Correct Answer

verified
Correct Answer
verified
Multiple Choice
Exhibit 2-1 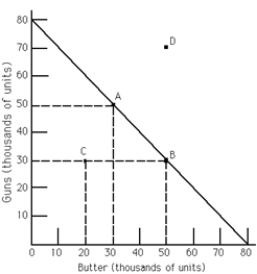 -Refer to Exhibit 2-1.The PPF illustrates
A) constant opportunity costs between guns and butter.
B) that guns are more important than butter.
C) increasing opportunity costs between guns and butter.
D) the opportunity cost of one unit of guns is four units of butter.
E) none of the above
Correct Answer

verified
Correct Answer
verified
Multiple Choice
Exhibit 2-4 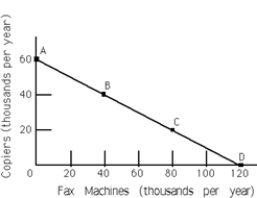 -Refer to Exhibit 2-4.The line joining points A and D is called the
A) production function frontier.
B) utility function.
C) production possibilities frontier.
D) demand curve.
Correct Answer

verified
Correct Answer
verified
Multiple Choice
Which of the following is not true about production possibilities frontiers?
A) moving from one point to another on a PPF incurs a tradeoff
B) economic growth is shown by shifting the PPF outward
C) unemployment of resources is shown by shifting the PPF inward
D) a PPF can shift inward or outward
Correct Answer

verified
Correct Answer
verified
Multiple Choice
Exhibit 2-6 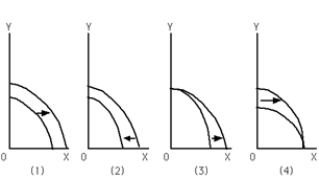 -Refer to Exhibit 2-6.Which graph depicts a discovery of a new cheap source of energy that assists in the production of both good X and good Y?
A) (1)
B) (2)
C) (3)
D) (4)
E) none of the above
Correct Answer

verified
Correct Answer
verified
Multiple Choice
An increase in the quantity of resources available
A) shifts the PPF leftward.
B) shifts the PPF rightward.
C) moves the economy to a new point up along a given PPF.
D) moves the economy to a new point down along a given PPF.
Correct Answer

verified
Correct Answer
verified
Multiple Choice
In the production possibilities framework,economic growth is depicted by the PPF
A) shifting leftward (toward the origin) .
B) shifting rightward (away from the origin) .
C) becoming a straight line rather than a bowed outward curve.
D) becoming bowed outward rather than a straight line.
Correct Answer

verified
Correct Answer
verified
Multiple Choice
Exhibit 2-5 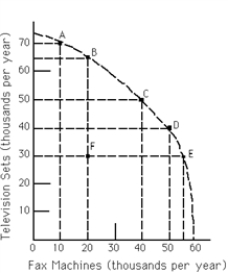 -Jose has one evening in which to prepare for two exams and can employ one of two possible strategies:
Strategy
Score in Economics
Score in Statistics
A
94
79
B
77
90
The opportunity cost of receiving a 94 on the economics exam is __________ points on the statistics exam.
A) 79
B) 17
C) 11
D) 90
Correct Answer

verified
Correct Answer
verified
Multiple Choice
Exhibit 2-6  -Refer to Exhibit 2-6.Which graph depicts a technological breakthrough in the production of good Y only?
A) (1)
B) (2)
C) (3)
D) (4)
E) none of the above
Correct Answer

verified
Correct Answer
verified
Multiple Choice
Exhibit 2-6  -Refer to Exhibit 2-6.Which graph depicts society's choice to produce more of good X and less of good Y?
A) (1)
B) (2)
C) (3)
D) (4)
E) none of the above
Correct Answer

verified
Correct Answer
verified
Multiple Choice
A decrease in the quantity of resources
A) shifts the PPF leftward.
B) shifts the PPF rightward.
C) moves the economy up a given PPF.
D) moves the economy down a given PPF.
Correct Answer

verified
Correct Answer
verified
Multiple Choice
If an economy can produce a maximum of 100 units of good X and the opportunity cost of 1X is always 5Y,then what is the maximum number of units of good Y the economy can produce?
A) 250
B) 100
C) 20
D) 500
E) none of the above
Correct Answer

verified
Correct Answer
verified
Multiple Choice
An economy can produce either of these two combinations of goods X and Y: 1,000X and 0Y or 400Y and 0X.Furthermore,the opportunity cost between the two goods is always constant.Which of the following combinations of the two goods,X and Y,is it possible for the economy to produce?
A) 700 units of X and 280 units of Y
B) 600 units of X and 250 units of Y
C) 400 units of X and 150 units of Y
D) 100 units of X and 600 units of Y
E) 300 units of X and 280 units of Y
Correct Answer

verified
Correct Answer
verified
Multiple Choice
Exhibit 2-3 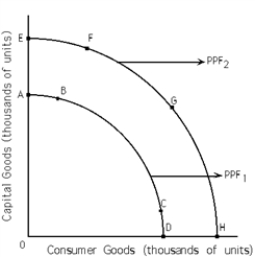 -Refer to Exhibit 2-3.If PPF1 is the relevant production possibilities frontier,society can choose points that lie only
A) below PPF1.
B) below or on PPF1.
C) on PPF2.
D) none of the above
Correct Answer

verified
Correct Answer
verified
Multiple Choice
Exhibit 2-4  -Refer to Exhibit 2-4.The opportunity cost of moving from point A to point B is
A) 60,000 copiers.
B) 40,000 copiers.
C) 20,000 copiers.
D) 20,000 fax machines.
E) 40,000 fax machines.
Correct Answer

verified
Correct Answer
verified
Multiple Choice
Points that lie outside (or beyond) the PPF are
A) attainable.
B) unattainable.
C) efficient.
D) inefficient.
Correct Answer

verified
Correct Answer
verified
Multiple Choice
Which of the following statements is true?
A) The concept of opportunity costs cannot be illustrated within a PPF framework.
B) If scarcity did not exist,neither would a PPF.
C) All PPFs are downward-sloping straight lines.
D) There are more attainable points than unattainable points in every PPF diagram.
Correct Answer

verified
Correct Answer
verified
Multiple Choice
If there is always a 4-for-1 tradeoff between producing good X and good Y,it follows that the opportunity cost of X (in terms of Y) ____________________ and the PPF for these two goods is ______________________.
A) decreases at low levels of X;a straight line
B) rises at high levels of Y;bowed-outward
C) decreases at high levels of X;bowed-outward
D) is always the same;a straight line
Correct Answer

verified
Correct Answer
verified
Multiple Choice
The point where the PPF intersects the vertical axis is
A) unattainable.
B) attainable and productive efficient.
C) attainable but productive inefficient.
D) attainable and neither productive efficient nor productive inefficient.
Correct Answer

verified
Correct Answer
verified
Multiple Choice
If there is an increase in the amount of good B foregone as every additional unit of good A is produced,the PPF between goods A and B would
A) be a straight line.
B) be a bowed-outward curve.
C) be a bowed-inward curve.
D) not exist.
Correct Answer

verified
Correct Answer
verified
Showing 81 - 100 of 132
Related Exams