A) the student scored higher than 80% of all others who took the exam
B) the student scored worse than 80% of all others who took the exam
C) Of all those who took the exam,only 80% of them completed it
D) the student would score the same grade on the exam 80% of the time
Correct Answer

verified
A
Correct Answer
verified
Multiple Choice
A researcher distributes frequencies into the following intervals: 1-10,11-20,21-30,31-40,41-50,and 51 and above.What is wrong with this frequency distribution?
A) The interval width is too small.
B) The interval width is unequal.
C) The class intervals overlap.
D) One interval is an open class.
Correct Answer

verified
D
Correct Answer
verified
Multiple Choice
As a general rule,a simple frequency distribution should have between
A) 3 and 6 intervals
B) 5 and 10 intervals
C) 8 and 12 intervals
D) 5 and 20 intervals
Correct Answer

verified
Correct Answer
verified
Multiple Choice
When cumulating frequencies from the bottom up,the data are discussed in terms of
A) at most
B) less than
C) at or below
D) all of the above
Correct Answer

verified
Correct Answer
verified
Multiple Choice
A researcher records the number of children at a local school from single-,divorced-,and married-parent homes.This frequency data would be best displayed as a
A) bar chart
B) frequency polygon
C) histogram
D) ogive
Correct Answer

verified
Correct Answer
verified
Multiple Choice
The ________ is the percentage of scores with values that fall below a specified score in a distribution,is called the:
A) percentile rank
B) interval
C) relative frequency
D) percentile point
Correct Answer

verified
Correct Answer
verified
True/False
A relative frequency is typically used with smaller,but not larger,data sets.
Correct Answer

verified
Correct Answer
verified
Multiple Choice
A researcher distributes frequencies into the following classes: absent,tardy,present.What type of data are distributed?
A) nominal data
B) qualitative data
C) ungrouped data
D) all of the above
Correct Answer

verified
Correct Answer
verified
Multiple Choice
A percentile point is
A) the value of a score on a measurement scale below which a specified percentage of scores in a distribution fall
B) a summary display that distributes the sum of percentages across a series of intervals
C) an interval with no defined upper or lower boundary
D) the range of values contained in each interval of a grouped frequency distribution
Correct Answer

verified
Correct Answer
verified
True/False
Whether you cumulate a frequency distribution from the bottom up or the top down depends on how you want to discuss the data.
Correct Answer

verified
Correct Answer
verified
True/False
A histogram is basically a bar chart where the bars do not touch.
Correct Answer

verified
Correct Answer
verified
Multiple Choice
The sum of relative frequencies for each interval is _____.
A) 1.00
B) 100%
C) equal to the total number of scores in a distribution
D) both A and B
Correct Answer

verified
Correct Answer
verified
Multiple Choice
The following is a simple frequency distribution table.If we convert this frequency distribution to relative percentages,which of the following gives the corresponding percentages in each interval listed from the top down. 
A) 20%,33%,50%,67%,100%
B) 0.2,0.13,0.17,0.33,0.17
C) 20%,13%,17%,33%,17%
D) 6,10,15,25,30
Correct Answer

verified
Correct Answer
verified
Multiple Choice
The following is a simple frequency distribution table.Suppose we convert this table to a cumulative frequency distribution.The frequencies in each interval of the cumulative frequency distribution would be 
A) 5,8,10,14,20 (top down summary)
B) 6,10,12,15,20 (bottom up summary)
C) both A and B,depending on how the data were summarized
D) It is not possible to summarize the data using a cumulative frequency distribution.
Correct Answer

verified
C
Correct Answer
verified
Multiple Choice
A researcher measures the time (in seconds) that it takes children to complete a basic reading skills task.What type of graphical display would be most appropriate for summarizing the frequency of children falling into different intervals of time?
A) histogram
B) bar chart
C) scatter gram
D) all of the above
Correct Answer

verified
Correct Answer
verified
True/False
A circular graph that displays the relative percentage of a frequency distribution into sectors is called a scatter gram.
Correct Answer

verified
Correct Answer
verified
Multiple Choice
A researcher finds that 12% of participants make between 3-5 visits to a physician each year.What are the real limits for this interval?
A) 3-5
B) 2.5-5.5
C) 2.5-3.5
D) equal to the sum of the products for the previous interval
Correct Answer

verified
Correct Answer
verified
Multiple Choice
A researcher reports that 12 persons in a sample of 60 reported getting between 4 and 6 hours of sleep per night.What is the relative percentage for this interval?
A) 24%
B) 22%
C) 20%
D) There is not enough information to answer this question.
Correct Answer

verified
Correct Answer
verified
Multiple Choice
Grouped data are to ungrouped data as
A) quantitative is to qualitative
B) qualitative is to quantitative
C) inferential is to descriptive
D) descriptive is to inferential
Correct Answer

verified
Correct Answer
verified
Multiple Choice
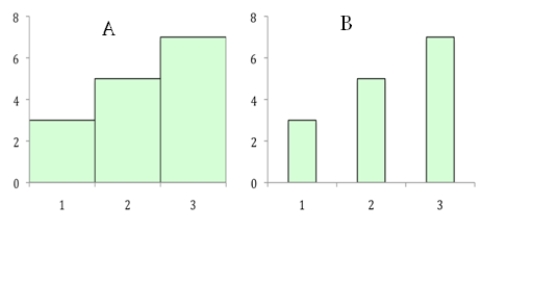
State the type of graphical display for Graph A and Graph B. 
A) A is a bar chart;B is a histogram.
B) B is a bar chart;A is a histogram.
C) Both graphs are bar charts.
D) Both graphs are histograms.
Correct Answer

verified
Correct Answer
verified
Showing 1 - 20 of 80
Related Exams