A) The number of sellers of mangos decreases.
B) There is an advance in technology that reduces the cost of producing mangos.
C) The price of mangos falls.
D) The price of fertilizer increases,and fertilizer is an input in the production of mangos.
Correct Answer

verified
C
Correct Answer
verified
Multiple Choice
An decrease in the price of oranges would lead to a(n)
A) increased supply of oranges.
B) increase in the prices of inputs used in orange production.
C) a movement down and to the left along the supply curve for oranges.
D) a movement up and to the right along the supply curve for oranges.
Correct Answer

verified
Correct Answer
verified
Multiple Choice
An improvement in production technology will
A) increase a firm's costs and increase its supply.
B) increase a firm's costs and decrease its supply.
C) decrease a firm's costs and increase its supply.
D) decrease a firm's costs and decrease its supply.
Correct Answer

verified
Correct Answer
verified
Multiple Choice
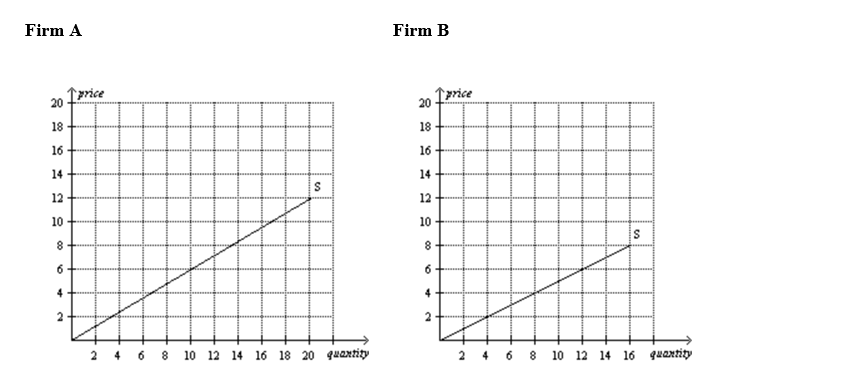
Figure 4-12
 -Refer to Figure 4-12.If these are the only two sellers in the market,then the market quantity supplied at a price of $6 is
A) 2 units.
B) 10 units.
C) 12 units.
D) 22 units.
Correct Answer

verified
Correct Answer
verified
Multiple Choice
Which of the following demonstrates the law of supply?
A) When leather became more expensive,belt producers decreased their supply of belts.
B) When car production technology improved,car producers increased their supply of cars.
C) When sweater producers expected sweater prices to rise in the near future,they decreased their current supply of sweaters.
D) When ketchup prices rose,ketchup sellers increased their quantity supplied of ketchup.
Correct Answer

verified
Correct Answer
verified
Multiple Choice
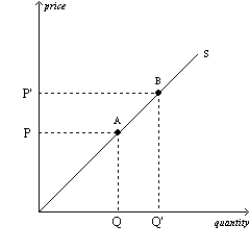
Figure 4-11  -Refer to Figure 4-11.The movement from point A to point B on the graph represents
A) an increased willingness and ability on the part of suppliers to supply the good at each possible price.
B) an increase in the number of suppliers.
C) a decrease in the price of a relevant input.
D) an increase in the price of the good that is being supplied and the suppliers' responses to that price change.
Correct Answer

verified
Correct Answer
verified
Multiple Choice
A decrease in the number of sellers in the market causes
A) the supply curve to shift to the left.
B) the supply curve to shift to the right.
C) a movement up and to the right along a stationary supply curve.
D) a movement downward and to the left along a stationary supply curve.
Correct Answer

verified
Correct Answer
verified
Multiple Choice
A movement upward and to the right along a supply curve is called a(n)
A) increase in supply.
B) decrease in supply.
C) decrease in quantity supplied.
D) increase in quantity supplied.
Correct Answer

verified
Correct Answer
verified
Multiple Choice
Ashley bakes bread that she sells at the local farmer's market.If she purchases a new convection oven that reduces the costs of baking bread,the
A) supply curve for Ashley's bread will increase.
B) supply curve for Ashley's bread will decrease.
C) demand curve for Ashley's bread will increase.
D) demand curve for Ashley's bread will decrease.
Correct Answer

verified
Correct Answer
verified
Multiple Choice
Figure 4-12
 -Refer to Figure 4-12.If these are the only two sellers in the market,then the market quantity supplied at a price of $8 is
A) 14 units.
B) 15 units.
C) 16 units.
D) 29 units.
Correct Answer

verified
Correct Answer
verified
Multiple Choice
Suppose an increase in the price of rubber coincides with an advance in the technology of tire production.As a result of these two events,the demand for tires
A) decreases,and the supply of tires increases.
B) is unaffected,and the supply of tires decreases.
C) is unaffected,and the supply of tires increases.
D) None of the above is necessarily correct.
Correct Answer

verified
Correct Answer
verified
Multiple Choice
Which of the following events could cause an increase in the supply of ceiling fans?
A) The number of sellers of ceiling fans increases.
B) There is an increase in the price of air conditioners,and consumers regard air conditioners and ceiling fans as substitutes.
C) There is an increase in the price of the motor that powers ceiling fans.
D) All of the above are correct.
Correct Answer

verified
A
Correct Answer
verified
Multiple Choice
Lead is an important input in the production of crystal.If the price of lead decreases,then we would expect the supply of
A) crystal to be unaffected.
B) crystal to decrease.
C) crystal to increase.
D) lead to increase.
Correct Answer

verified
Correct Answer
verified
Multiple Choice
A supply schedule is a table that shows the relationship between
A) price and quantity supplied.
B) input costs and quantity supplied.
C) quantity demanded and quantity supplied.
D) profit and quantity supplied.
Correct Answer

verified
Correct Answer
verified
Multiple Choice
If the number of sellers in a market increases,then the
A) demand in that market will increase.
B) supply in that market will increase.
C) supply in that market will decrease.
D) demand in that market will decrease.
Correct Answer

verified
Correct Answer
verified
Multiple Choice
The supply curve for a good is a line that relates
A) profit and quantity supplied.
B) quantity supplied and quantity demanded.
C) price and quantity supplied.
D) price and profit.
Correct Answer

verified
Correct Answer
verified
Multiple Choice
Once the supply curve for a product or service is drawn,it
A) remains stable over time.
B) can shift either rightward or leftward.
C) is possible to move along the curve,but the curve will not shift.
D) tends to become steeper over time.
Correct Answer

verified
Correct Answer
verified
Multiple Choice
The line that relates the price of a good and the quantity supplied of that good is called the supply
A) schedule,and it usually slopes upward.
B) schedule,and it usually slopes downward.
C) curve,and it usually slopes upward.
D) curve,and it usually slopes downward.
Correct Answer

verified
C
Correct Answer
verified
Multiple Choice
An increase in the price of a good would
A) increase the supply of the good.
B) increase the amount purchased by buyers.
C) give producers an incentive to produce more.
D) decrease both the quantity demanded of the good and the quantity supplied of the good.
Correct Answer

verified
Correct Answer
verified
Multiple Choice
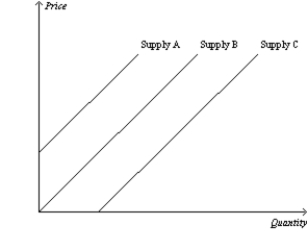
Figure 4-15  -Refer to Figure 4-15.Which of the following would cause the supply curve to shift from Supply A to Supply C in the market for sail boats?
A) an increase in the price of sailboats
B) a decrease in the number of firms selling sailboats
C) a decrease in the price of fiberglass and sail cloth
D) a decrease in the price of America's Cup sailing t-shirts
Correct Answer

verified
Correct Answer
verified
Showing 1 - 20 of 96
Related Exams