A) if P = $8,then Q = 8
B) if P = $10,then Q = 10
C) Q increases as P increases
D) Q decreases as P decreases
E) there is a positive relation between Q and P
Correct Answer

verified
Correct Answer
verified
Multiple Choice
Exhibit 1-3 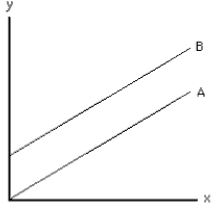 -In Exhibit 1-3,for any value of y,the
A) value of x is larger on curve A than on curve B
B) value of x is smaller on curve A than on curve B
C) value of x is the same on curve A as on curve B
D) slope of line A is increasing
E) slope of line B is negative
Correct Answer

verified
Correct Answer
verified
Multiple Choice
Exhibit 1-1 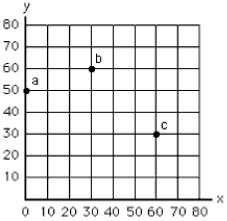 -In Exhibit 1-1 the movement from point a to point b represents
A) an increase in x of 30 units and an increase in y of 10 units
B) an increase in x of 10 units and an increase in y of 30 units
C) an increase in x of 60 units and a decrease in y of 20 units
D) an increase in x of 20 units and a decrease in y of 60 units
E) an increase in x of 20 units and a decrease in y of 30 units
Correct Answer

verified
Correct Answer
verified
Multiple Choice
The statement that there is a direct relation between x and y means that
A) x and y move in the same direction
B) x causes y
C) y causes x
D) either y causes x or x causes y
E) the causal connection between x and y is immediate
Correct Answer

verified
Correct Answer
verified
Multiple Choice
Exhibit 1-1  -Point a in Exhibit 1-1 represents
A) the origin
B) x = 0,y = 50
C) x = 50,y = 0
D) x + y = 50
E) y = 0; no information is given about x
Correct Answer

verified
Correct Answer
verified
Multiple Choice
Exhibit 1-8 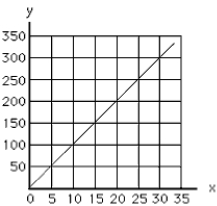 -The slope of a vertical line is
A) infinitely large
B) zero
C) positive
D) negative
E) infinitely small
Correct Answer

verified
Correct Answer
verified
Multiple Choice
Exhibit 1-2 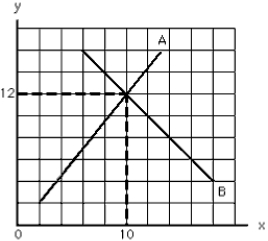 -In Exhibit 1-2,when x is less than 10,the
A) value of y is larger on curve A than on curve B
B) value of y is smaller on curve A than on curve B
C) value of y is the same on curve A as on curve B
D) slope of line A is negative
E) slope of line B is positive
Correct Answer

verified
Correct Answer
verified
Multiple Choice
Suppose y is measured on the vertical axis,x is on the horizontal axis,and the various combinations of x and y are shown by a nonvertical straight line.Which of the following must be true?
A) There is a negative relation between x and y.
B) There is a positive relation between x and y.
C) There is a causal relation between x and y.
D) If the value of x is known,the value of y can be determined.
E) The value of y is independent of the value of x.
Correct Answer

verified
Correct Answer
verified
Multiple Choice
A line is tangent to a curve if it
A) crosses the curve at one point
B) touches the curve at one point,without crossing it
C) crosses the curve at a minimum of two points
D) never touches the curve
E) forms a right triangle with the curve
Correct Answer

verified
Correct Answer
verified
Multiple Choice
Exhibit 1-16 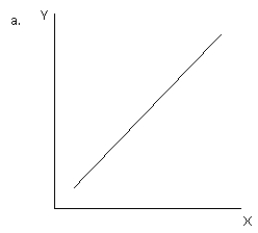
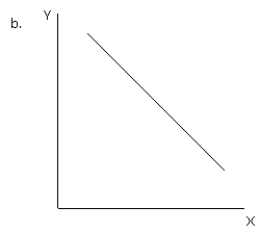
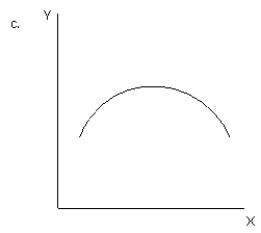
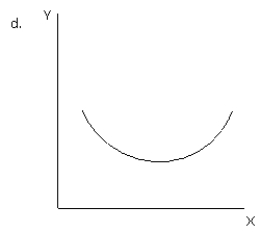
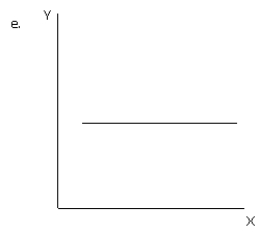 -Refer to exhibit 1-16.Which of the graphs illustrates no relationship between variable X and variable Y?
A) a
B) b
C) c
D) d
E) e
Correct Answer

verified
Correct Answer
verified
Multiple Choice
Exhibit 1-1  -In Exhibit 1-1 the movement from point a to point c represents
A) an increase in x of 30 units and an increase in y of 10 units
B) an increase in x of 10 units and an increase in y of 30 units
C) an increase in x of 60 units and a decrease in y of 20 units
D) an increase in x of 20 units and a decrease in y of 60 units
E) an increase in x of 20 units and a decrease in y of 30 units
Correct Answer

verified
Correct Answer
verified
Multiple Choice
A straight line tangent to a curved line at a point
A) crosses the curved line at that point
B) crosses the curved line at many points
C) has the same slope as the curved line at that point
D) is steeper than the curve at all other points
E) has a smaller slope than all other points on the curve
Correct Answer

verified
Correct Answer
verified
Multiple Choice
A graph is a
A) lengthy,inefficient,and inconvenient way to illustrate information
B) diagram illustrating a relationship between variables
C) method of proving causation
D) tool for incorporating all major and minor variables in one illustration
E) clear way to see how the fallacy of composition works
Correct Answer

verified
Correct Answer
verified
Showing 61 - 73 of 73
Related Exams