A) quantity of tacos demanded equals the quantity of tacos supplied.
B) quantity of tacos demanded is greater than the quantity of tacos supplied.
C) quantity of tacos demanded is less than the quantity of tacos supplied.
D) market is at equilibrium.
E) supply curve of tacos will shift leftward to eliminate the surplus.
Correct Answer

verified
Correct Answer
verified
Multiple Choice
A decrease in the price of a complement in production leads to
A) a decrease in the supply of the good in question.
B) an increase in the supply of the good in question.
C) no change in the supply of the good in question.
D) a decrease in the quantity supplied of the good in question.
E) an increase in the supply of the good in question and a decrease in the quantity supplied of the good in question.
Correct Answer

verified
Correct Answer
verified
Multiple Choice
When the price of oranges increases,
A) the supply of oranges increases.
B) the quantity of oranges demanded increases.
C) the quantity of oranges supplied increases.
D) the supply of oranges decreases.
E) none of the above
Correct Answer

verified
Correct Answer
verified
Multiple Choice
Consider the market for wheat.If there is an improvement in harvesting technology,
A) the supply curve for wheat shifts rightward.
B) the demand curve for wheat shifts rightward.
C) there is a movement up along the demand curve.
D) the equilibrium price rises.
E) the demand curve for wheat shifts leftward.
Correct Answer

verified
Correct Answer
verified
Multiple Choice
A demand curve
A) has an upward slope.
B) has a downward slope.
C) is a graph of the relationship between quantity demanded of a good and its price.
D) Both answers B and C are correct.
E) Both answers A and C are correct.
Correct Answer

verified
Correct Answer
verified
Multiple Choice
The phrase "a change in demand" most directly implies a
A) movement along a demand curve.
B) movement along the price curve.
C) change in the quantity demanded of a good.
D) shift of the demand curve.
E) movement along the quantity curve.
Correct Answer

verified
Correct Answer
verified
Multiple Choice
Gasoline prices increase by 50 percent and other things remain the same.As a result,there is
A) an increase in the demand for gasoline.
B) a decrease in the demand for gasoline.
C) no change in the quantity of gasoline demanded.
D) a decrease in the quantity of gasoline demanded.
E) More information is needed to determine if the demand for gasoline increases or decreases.
Correct Answer

verified
Correct Answer
verified
Multiple Choice
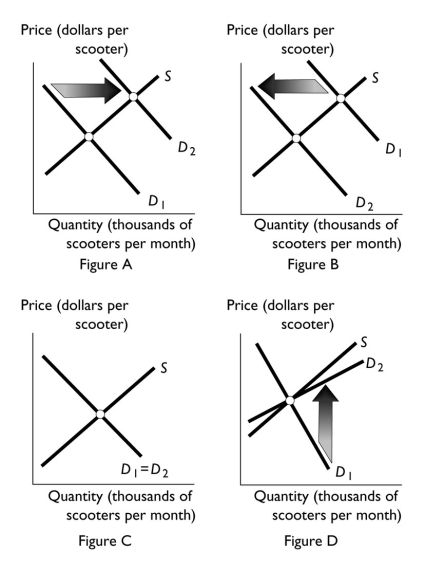
 -Scooters and bicycles are substitutes.Suppose that the price of a bicycle falls.Which of the figures above best illustrates how this fall in price affects the demand curve for scooters?
A) Figure A
B) Figure B
C) Figure C
D) Figure D
E) None of the above answers is correct because the change in the price of a bicycle will affect the supply curve not the demand curve.
Correct Answer

verified
Correct Answer
verified
Multiple Choice
Ramen noodles are a staple food item for many college students.Ramen noodles are very inexpensive,easy to prepare,and can be combined easily with other foods.After students graduate,find employment,and earn a higher income,they decrease their Ramen noodle purchases significantly.In this case,Ramen noodles are
A) a normal good.
B) an inferior good.
C) a complement for higher income people.
D) a substitute good.
E) None of the above answers is correct.
Correct Answer

verified
Correct Answer
verified
Multiple Choice
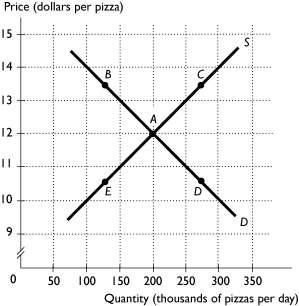
 -The above figure shows the market for pizza.The market is in equilibrium when people's incomes decrease.If pizza is a normal good,then which point represents the most likely new price and quantity?
A) A
B) B
C) C
D) D
E) E
Correct Answer

verified
Correct Answer
verified
Multiple Choice
Consider the market for feather pillows.If there is an increase in the price of feather dusters,a substitute in production for feather pillows,then
A) the price of feather pillows decreases.
B) the demand curve for feather pillows shifts leftward.
C) the supply curve for feather pillows shifts leftward.
D) there is a downward movement along the demand curve for feather pillows.
E) the demand curve for feather pillows shifts rightward.
Correct Answer

verified
Correct Answer
verified
Multiple Choice
An increase in the number of fast-food restaurants
A) raises the price of fast-food meals.
B) increases the demand for fast-food meals.
C) increases the supply of fast-food meals.
D) increases the demand for substitutes for fast-food meals.
E) increases both the demand and supply of fast-food meals.
Correct Answer

verified
Correct Answer
verified
Multiple Choice
The American Dairy Association starts a highly successful advertising campaign that makes most people want to drink more milk.As a result,
A) the demand for milk increases.
B) the quantity demanded of milk increases.
C) the price of milk falls to encourage people to drink more milk.
D) the demand for milk is not affected.
E) the demand for milk decreases because the price of milk rises.
Correct Answer

verified
Correct Answer
verified
Multiple Choice
Which of the following increases the supply of a good?
A) The price of a complement in production decreases.
B) Producers expect higher prices for the good in the future.
C) Productivity improves.
D) Prices of inputs used to produce the good rise.
E) The number of producers decreases.
Correct Answer

verified
Correct Answer
verified
Multiple Choice
The United Auto Workers bargained for higher wages and more benefits for autoworkers.As a result of the higher wages and increased benefits, I.the quantity of new automobiles supplied decreases. Ii.the supply of new automobiles decreases. Iii.the supply of new automobiles increases.
A) only i
B) only ii
C) only iii
D) both i and ii
E) Neither i,ii,nor iii is correct.
Correct Answer

verified
Correct Answer
verified
Multiple Choice
 -The above figure shows the market for pizza.The market is in equilibrium when new pizza firms enter the market.What point represents the most likely new price and quantity?
A) A
B) B
C) C
D) D
E) E
Correct Answer

verified
Correct Answer
verified
Multiple Choice
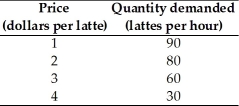
 -The table above gives the demand schedule for lattes at the Bottomless Cup.If the price of a latte is $3,then the quantity of lattes demanded is ________ an hour.
A) 90
B) 30
C) 80
D) 60
E) 230
Correct Answer

verified
Correct Answer
verified
Multiple Choice
Which of the following increases the demand for a good or service?
A) a fall in the price of the good or service
B) a smaller number of consumers wanting to buy the good or service
C) a rise in the price of the good or service
D) a rise in the price of a substitute good or service
E) a rise in the price of a complement
Correct Answer

verified
Correct Answer
verified
Multiple Choice
The downward slope of a demand curve
A) represents the law of demand.
B) shows that as the price of a good rises,consumers increase the quantity they demand.
C) indicates how the quantity demanded changes when incomes rise and the good is a normal good.
D) indicates how demand changes when incomes rise and the good is a normal good.
E) indicates how demand changes when the price changes and the good is a normal good.
Correct Answer

verified
Correct Answer
verified
Multiple Choice
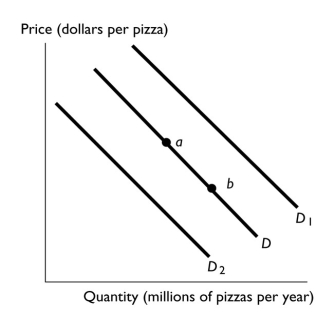
 -In the above figure,the shift in the demand curve from D to D2 can be the result of
A) an increase in income if pizza is a normal good.
B) an increase in the price of a sub sandwich,a substitute for pizza.
C) an increase in the price of soda,a complement to pizza.
D) a change in quantity demanded.
E) a decrease in the supply of pizza that raises the price of pizza.
Correct Answer

verified
Correct Answer
verified
Showing 121 - 140 of 334
Related Exams