Asked by
Francesca Bifulco
on Oct 16, 2024
Verified
Assuming a Normal model applies,a town's average annual snowfall (in cm) is modeled by N(42,8) \mathrm { N } ( 42,8 ) N(42,8) Draw and label the Normal model.Then find the interval for the middle 95% of snowfall.
A) 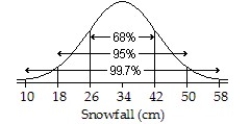 ; 18 to 50 cm
B) 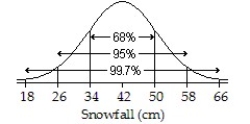 ; 34 to 50 cm
C)  ; 26 to 58 cm
D) 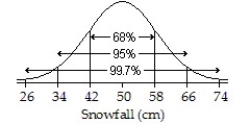 ; 34 to 66 cm
E) 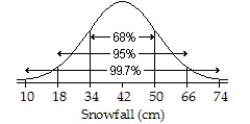 ; 18 to 66 cm
Normal Model
A bell-shaped probability distribution characterized by its mean and standard deviation, often used to describe naturally occurring phenomena.
Middle 95%
Refers to the central portion of a distribution that contains 95% of the data, often used in the context of confidence intervals indicating where the true population parameter lies with a certain level of confidence.
- Exploit the Normal distribution model for problem-solving in real-world contexts.
- Assess and interpret central percentage intervals under the Gaussian curve.

Verified Answer
EK

Learning Objectives
- Exploit the Normal distribution model for problem-solving in real-world contexts.
- Assess and interpret central percentage intervals under the Gaussian curve.
Related questions
An English Instructor Gave a Final Exam and Found a ...
For a Recent English Exam,use the Normal Model N(73,9 ...
The Amount of Jen's Monthly Phone Bill Is Normally Distributed ...
A Town's Average Snowfall Is 40 Cm Per Year with ...
Assuming a Normal Model Applies,a Town's Average Annual Snowfall (In \[\mathrm ...