Asked by
Alberta Bertie
on Oct 22, 2024
Verified
Malaria is a leading cause of infectious disease and death worldwide.It is also a popular example of a vector-borne disease that could be greatly affected by the influence of climate change.The scatterplot shows total precipitation (in mm)in select cities in West Africa on the x axis and the percent of people who tested positive for malaria in the select cities on the y axis in 2000. 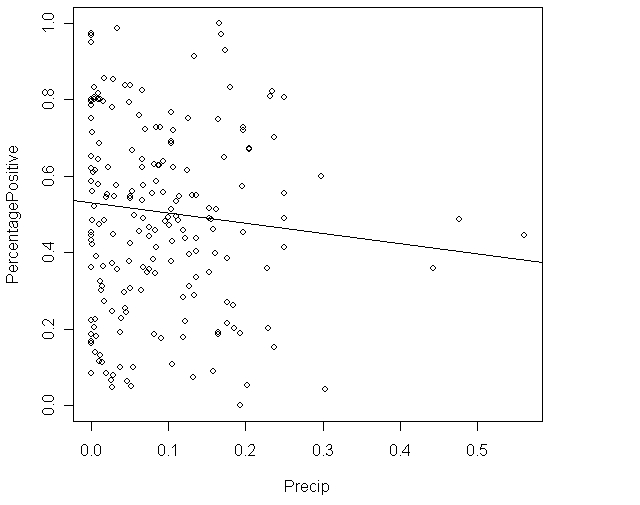
There are influential points in the scatterplot.
Influential Points
Data points that have a disproportionately large effect on the results of a statistical analysis, potentially skewing the analysis.
Scatterplot
A graphical representation where individual data points are plotted on a two-dimensional plane, showcasing the relationship between two variables.
Precipitation
Any form of water - liquid or solid - falling from the sky, including rain, snow, sleet, and hail.
- Recognize anomalies in datasets and comprehend their influence on scatter plots and the analysis of data.

Verified Answer
SA

Learning Objectives
- Recognize anomalies in datasets and comprehend their influence on scatter plots and the analysis of data.