Asked by
Samantha Floyd
on Nov 11, 2024
Verified
Figure 4.2 shows the demand curves for a good.A shift from demand curve D' to demand curve D in the figure below would be caused by a(n) :
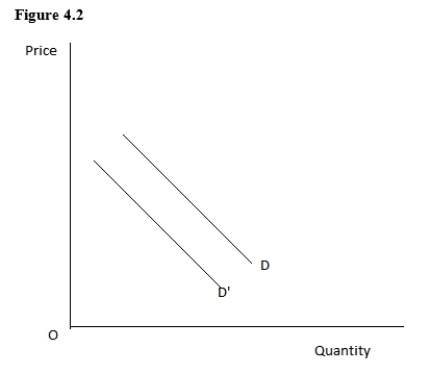
A) increase in the price of the good under consideration.
B) significant decrease in population because of emigration.
C) increase in the price of a substitute good.
D) decrease in the number of producers of the product.
E) decrease in the price of an important resource.
Demand Curves
Demand curves graphically demonstrate how the quantity demanded of a commodity varies with its price, highlighting the inverse relationship between prices and demand quantities.
Substitute Good
A product or service that satisfies the need of a consumer that another product or service fulfills.
Important Resource
A crucial element or input required for the production process or societal functioning.
- Acknowledge variables that provoke changes in the dynamics of demand and supply curves.

Verified Answer
AN

Learning Objectives
- Acknowledge variables that provoke changes in the dynamics of demand and supply curves.