Asked by
AC17UCS037 KABILAN
on Nov 11, 2024
Verified
Figure 4.2 shows the demand curves for a good.A shift from demand curve D to demand curve D' in the figure would be caused by a(n) :
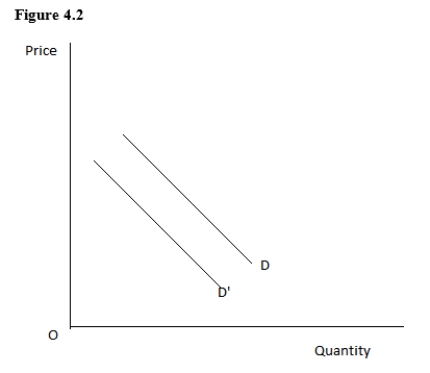
A) decrease in the price of the good under consideration.
B) significant increase in population because of immigration.
C) decrease in consumer income.
D) decrease in the number of producers of the product.
E) increase in the price of an important resource.
Immigration
The action of coming to live permanently in a foreign country.
Demand Curve
A graphical representation showing the relationship between the price of a good and the quantity demanded by consumers at those prices.
Consumer Income
Refers to the total earnings received by consumers, including wages, salaries, benefits, and any other income sources, influencing their purchasing power and spending behaviors.
- Identify elements that lead to alterations in demand and supply curves.
- Acknowledge the influence of alterations in population demographics and consumer tastes on demand levels.

Verified Answer
IJ

Learning Objectives
- Identify elements that lead to alterations in demand and supply curves.
- Acknowledge the influence of alterations in population demographics and consumer tastes on demand levels.